
Intro
It’s not easy to pick up this background image for the post. It shows the Manhattan Peninsula, New York, and the sky reflects the buildings on the ground. This fantasy scene reminds me the complex relationship between space and time, which closely related to the topic of this article: Spatiotemporal forecasting of traffic by using 3d convolutional neural networks.
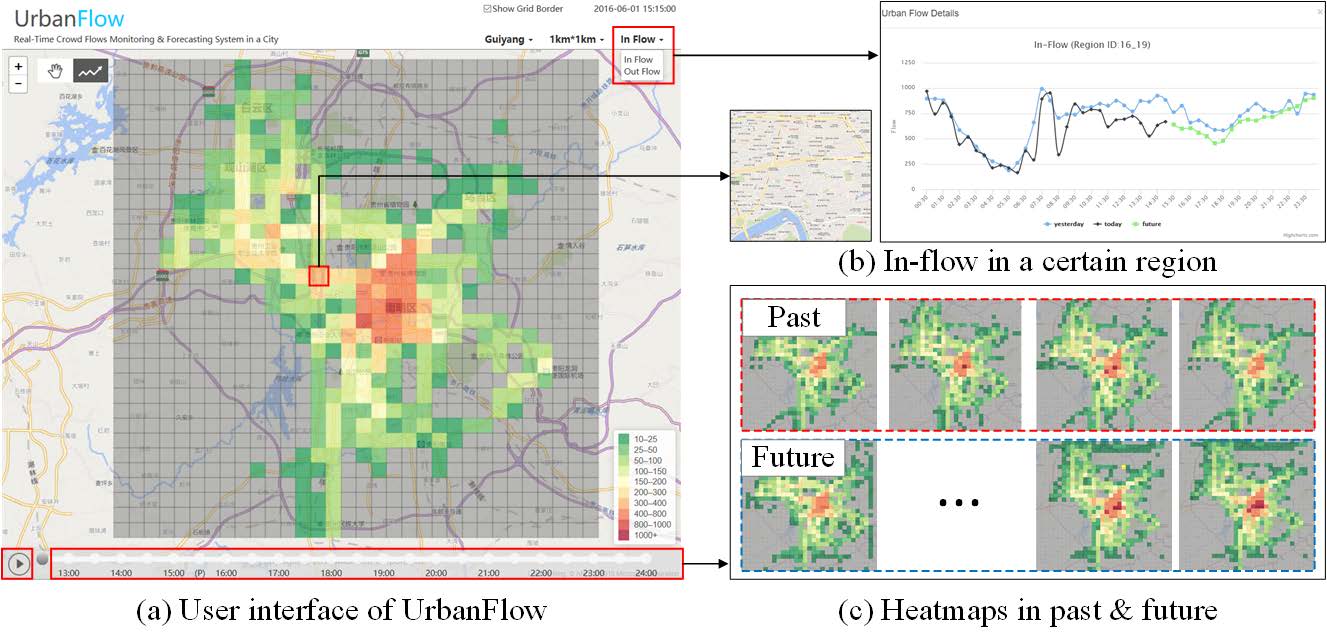
On December 31, 2014, a deadly stampede occurred in Shanghai, near Chen Yi Square on the Bund, where around 300,000 people had gathered for the new year celebration. 36 people were killed and there were 49 injured, 13 seriously (Wikipedia). From the follow-up reports, it can be known that Tencent’s user online information has roughly detected that the traffic in the area was too dense. So data from social media and cell phone signal can infer the regional crowd density. If the corresponding predictions and analysis can be made, such tragedies will not happen.
Traffic forecasting has been studied for decades. There are many outcomes of models and theories. For the regional prediction, it’s a prevalent way to split the research area into grids and analysis them by computer vision models. Each square in the girds just like the pixel in an image.
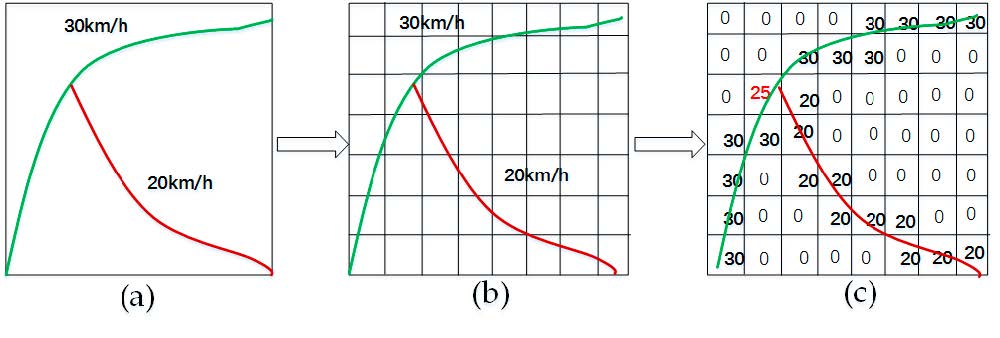
Zhang (2016) presented the classic Deep-ST model. It treats the research area as image and the predicted result combined with the convolutional models from different periods. However, the convert not only limited to traffic volume. The vehicle speed can also be transformed into images. The images below shows the traffic speed representation in a small-scale transportation network (Yu, et al 2017).
With the development of computer vision, deeper neural networks like ResNet has been presented recently. Zhang (2017) also upgraded the DeepST to ST-ResNet with ResNet models. However, the convolutional kernel in these models only focuses on spatial relations, not for a spatiotemporal space. It’s been proved that 3D Convolutional Networks can learn the spatiotemporal features (Tran 2015). But these improvements only appears in video related studies like behavior detection, human action detection, etc. So in this post, we will see the application of 3D ConvNets on traffic problems.
Convolutional operations
There are some different operations with the convolutional kernel in hidden layers. The following diagrams show the 2D convolutional operation with padding and dilation (Dumoulin and Visin, 2016 ). It’s different in 3D, but the ideas are same.
 |
 |
With the 3D convolutional operation, the kernel shape is 3 dimensional and it moves in 3 directions. Just like the animation below. For the transportation problems, the directions are latitude, longitude and time. In the model part, we also used padding and dilation with 3D kernels.
Data and Model
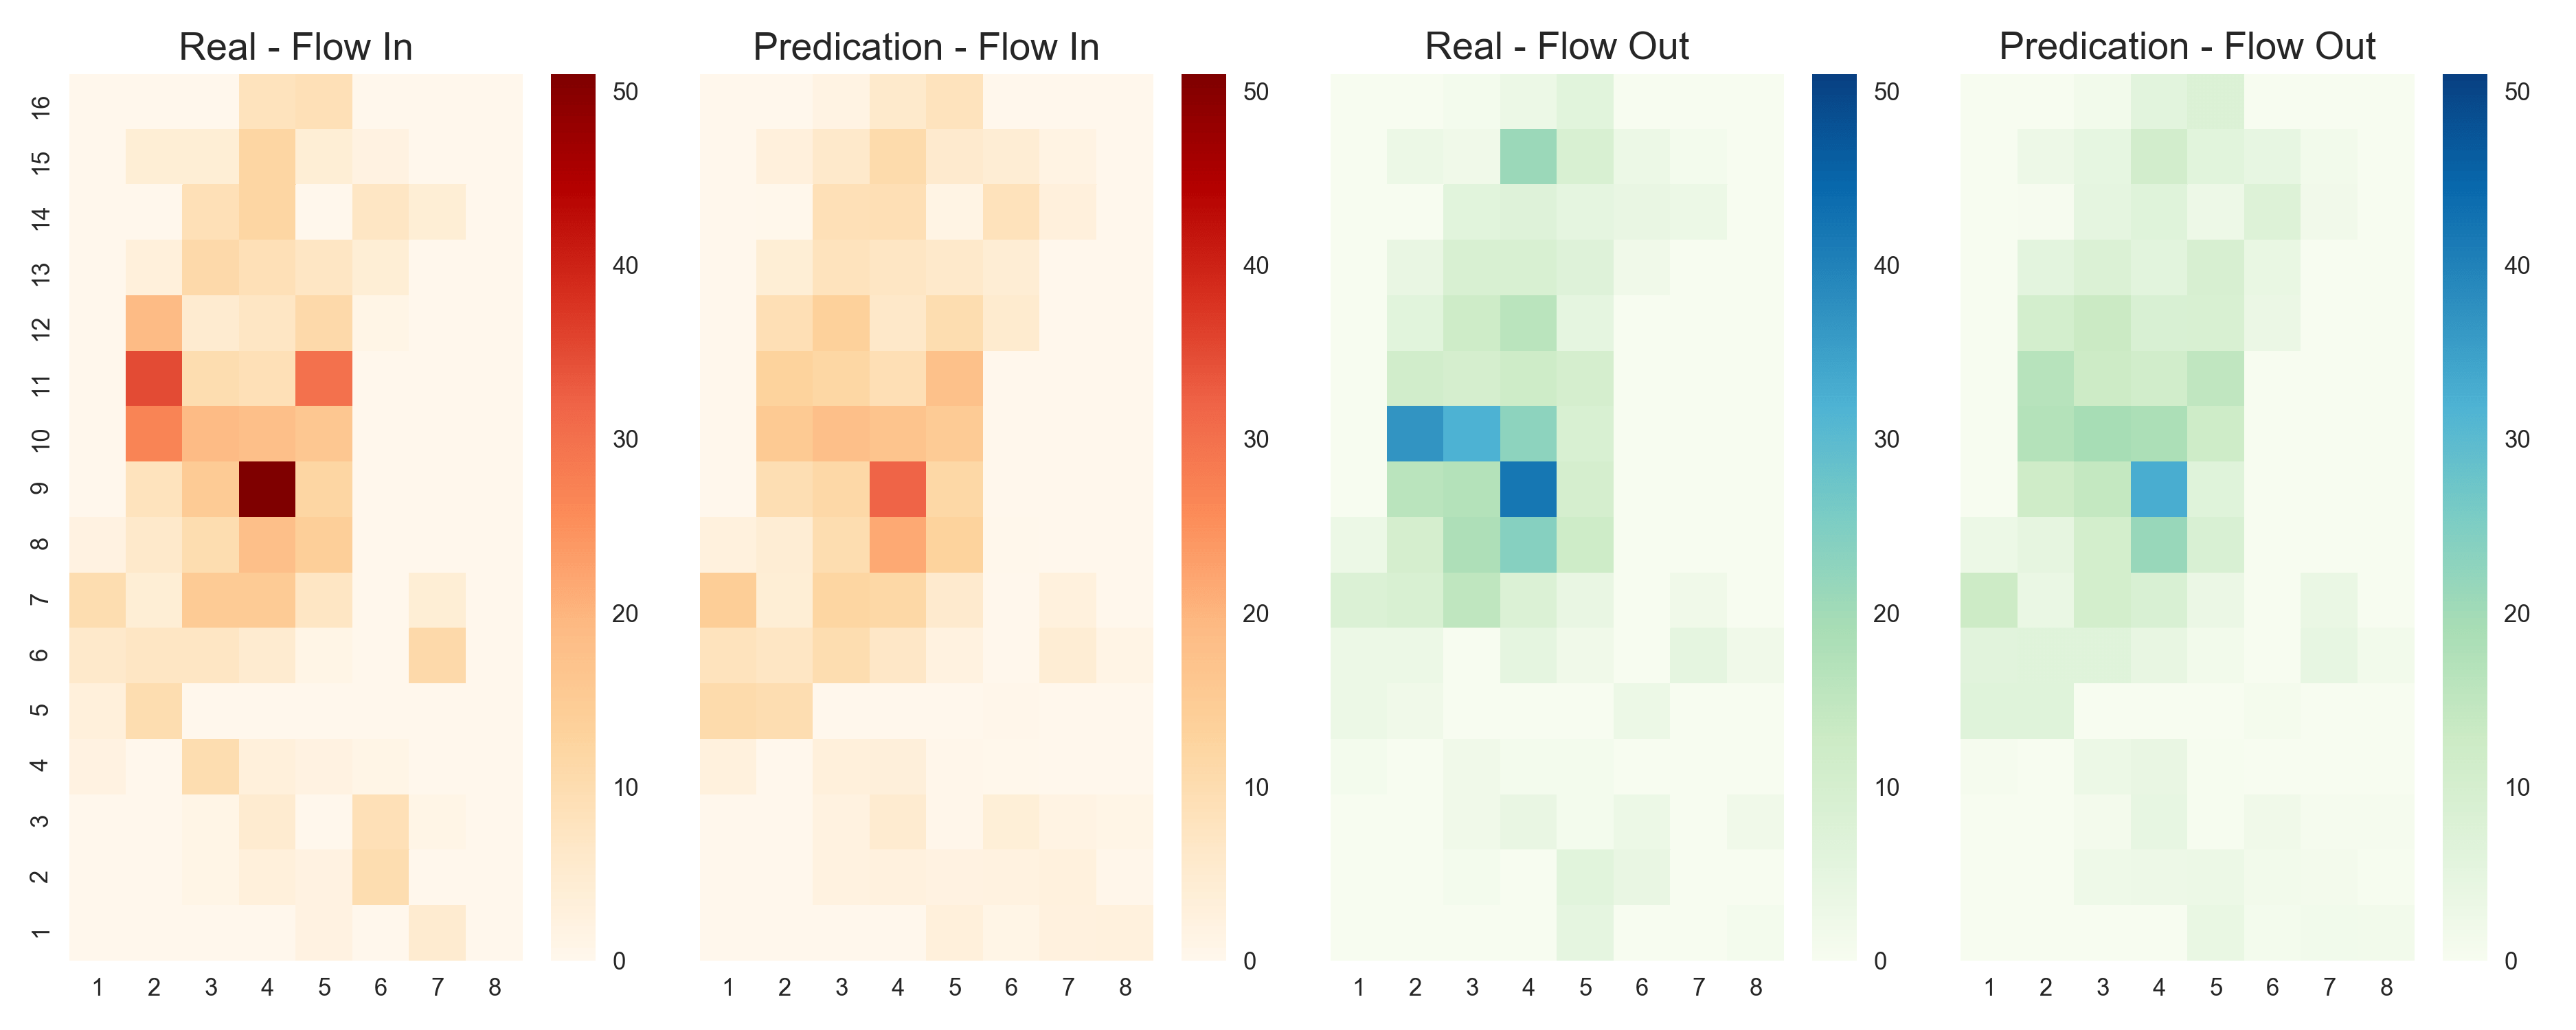
We take the bike sharing data in New York (BikeNYC) from the DeepST paper as an example here. Every circle stands for a station and the color means the number of bikes in dock. The research area is split into 16*8 grids, each square has in and out flow at a particular moment. The in and out flow are numbers of return and borrow bikes in the corresponding region.
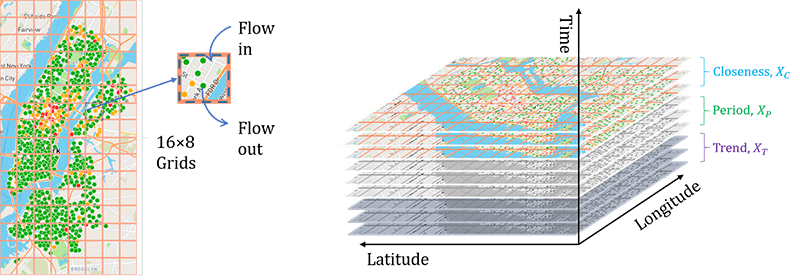
The input is a time sequence from the time level of closeness, period and trend. They stand for the different extract frequency from raw data. If stack them together, the input shape would be X168. The X is the number of timesteps.
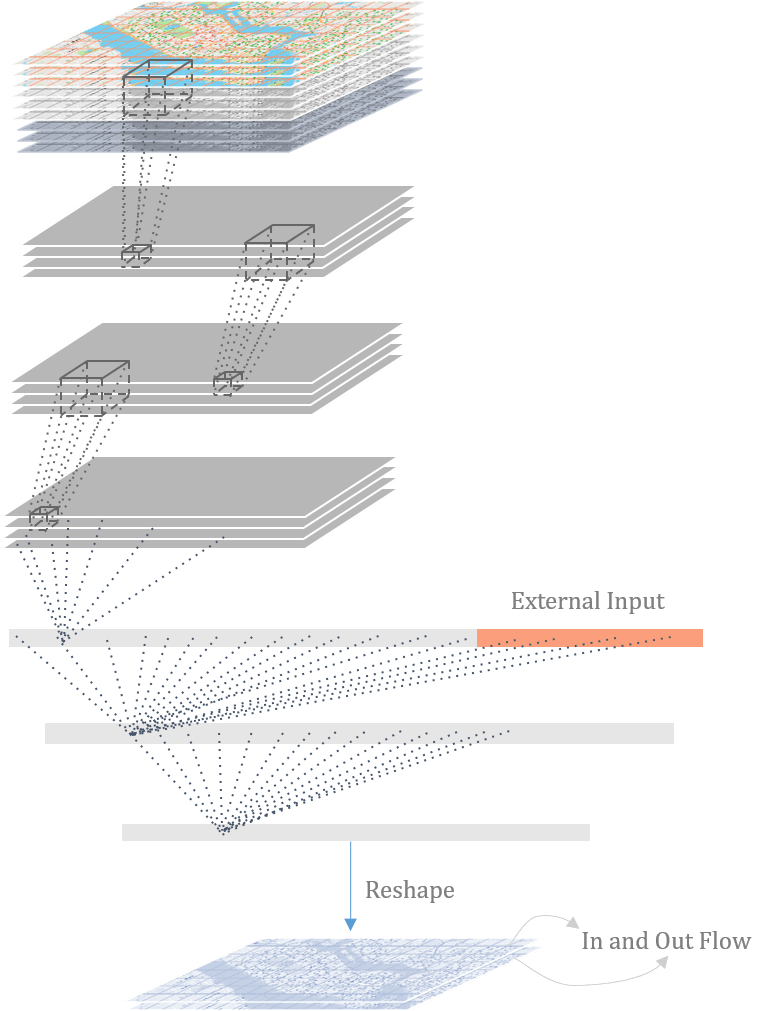
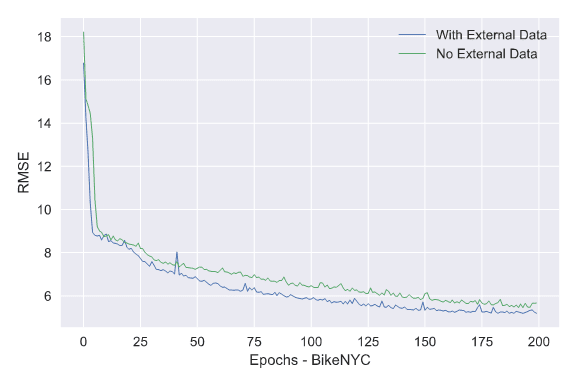
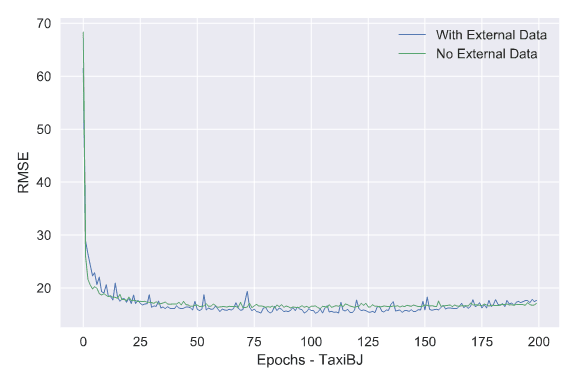
The model has three 3D convolutional layers and the flatten layer combines the external data like weather and holidays.
Experiments
I used Pytorch this time. The windows version just came out last month. It provides a lot of API and very easy to build a custom model structure. The author of ST-ResNet has opened his code, so we can reuse the dataset from Github.
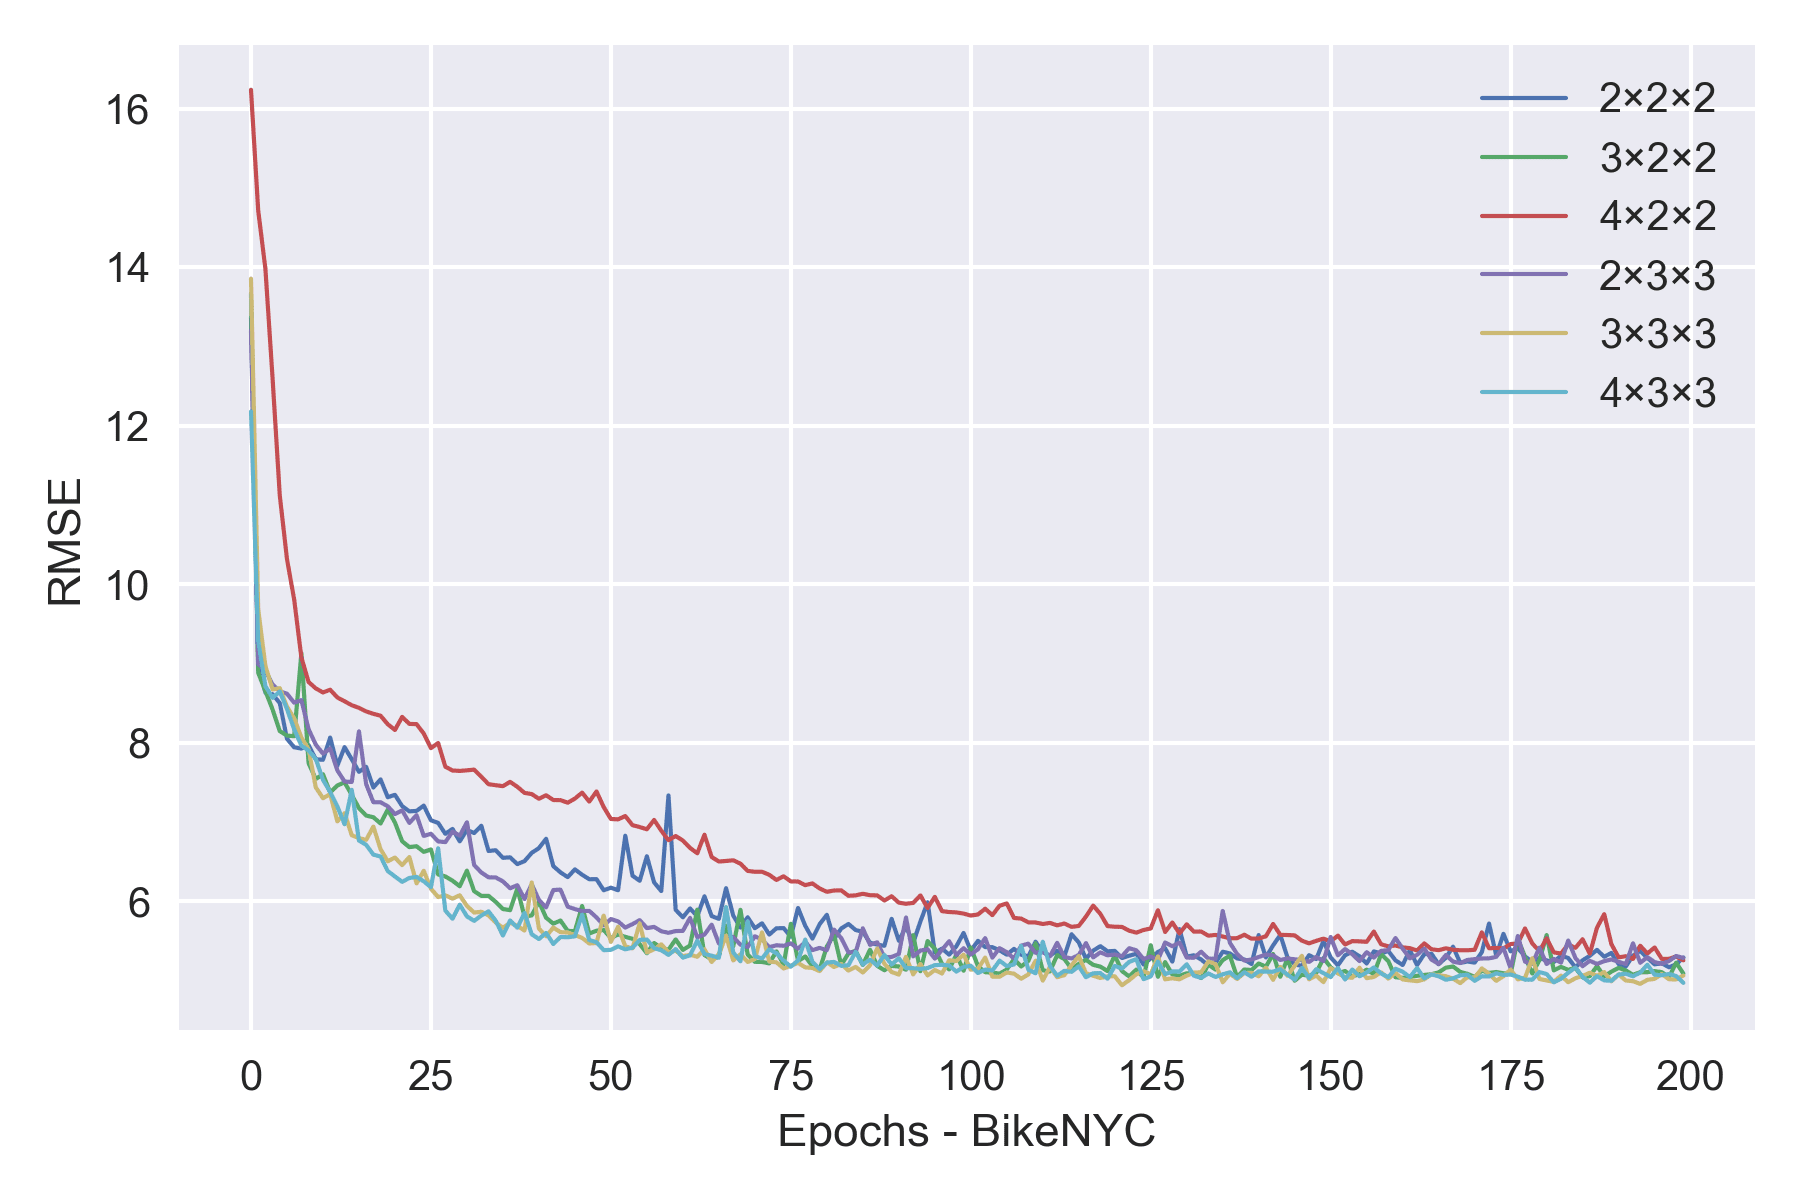
To get the best kernel size, we take different combinations for training test. It turns out that 3*3*3 is also the optimal option for transportation data just like other papers have pointed out in some behavior detection tasks.
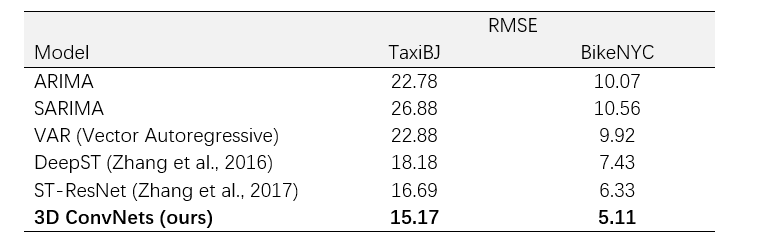
Although the model is much simpler than Deep-ST or ST-ResNet, it still achieved the best performance on BikeNYC and TaxiBJ datasets.
Visualization
Firstly, I have tried the Matplotlib in Python. The outcomes are good but they are static and not appropriate for the webpage. So I chose d3.js to draw the diagram from scratch. (The style with CSS and SVG tags is incompatible with this blog responsive CSS sheet. So I just give up displaying it on this page. Here is the gif version, simple and straightforward.)

Play around with this diagram: http://resuly.me/projects/3dconvs/
References
Zhang, J., Zheng, Y., Qi, D., Li, R., & Yi, X. (2016, October). DNN-based prediction model for spatio-temporal data. In Proceedings of the 24th ACM SIGSPATIAL International Conference on Advances in Geographic Information Systems (p. 92). ACM.
Zhang, J., Zheng, Y., & Qi, D. (2017, February). Deep Spatio-Temporal Residual Networks for Citywide Crowd Flows Prediction. In AAAI (pp. 1655-1661).
Yu, H., Wu, Z., Wang, S., Wang, Y., & Ma, X. (2017). Spatiotemporal recurrent convolutional networks for traffic prediction in transportation networks. Sensors, 17(7), 1501.
Tran, D., Bourdev, L., Fergus, R., Torresani, L., & Paluri, M. (2015, December). Learning spatiotemporal features with 3d convolutional networks. In Computer Vision (ICCV), 2015 IEEE International Conference on (pp. 4489-4497). IEEE.
Vincent Dumoulin, Francesco Visin – A guide to convolution arithmetic for deep learning