Part One: Bike-share in China and Suzhou
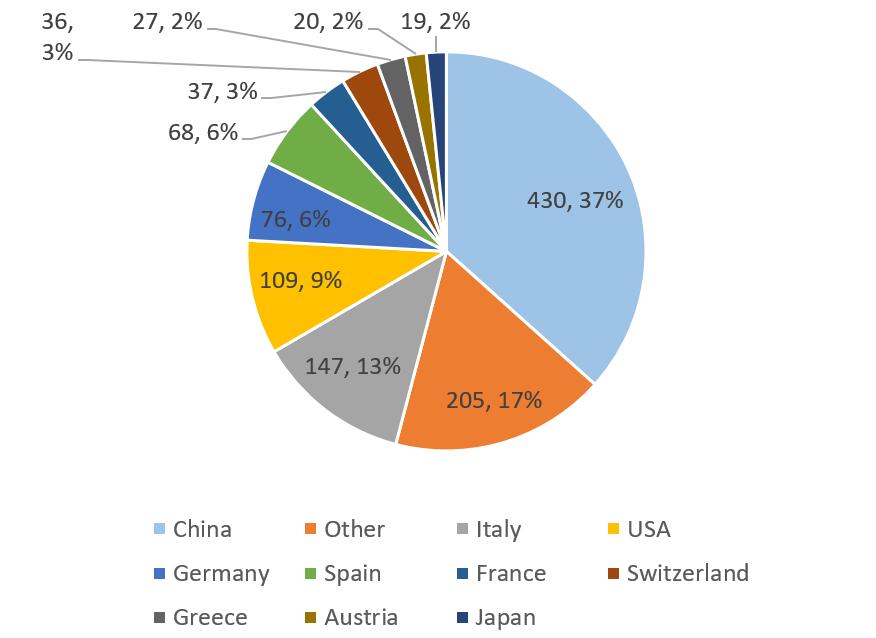
Bike-share systems (BSs) are generally believed to be a sustainable and healthy transport mode and have the potential to enhance public transport by offering a last-mile service. The merging of BSs worldwide has been a relatively new trend. By the end of 2016, 1,286 BSs had been deployed worldwide, among which, the largest and fastest increasing BSs market is in China -by the end of 2016, China had established 430 BSs with a bike fleet of 1.9 million, making it the largest BSs market in the world, followed by Italy and USA, as shown in the following figure (note that the uprising dockless bike-share systems like Mobike are not included).
Top 10 bike-share system countries (by the end of 2016)
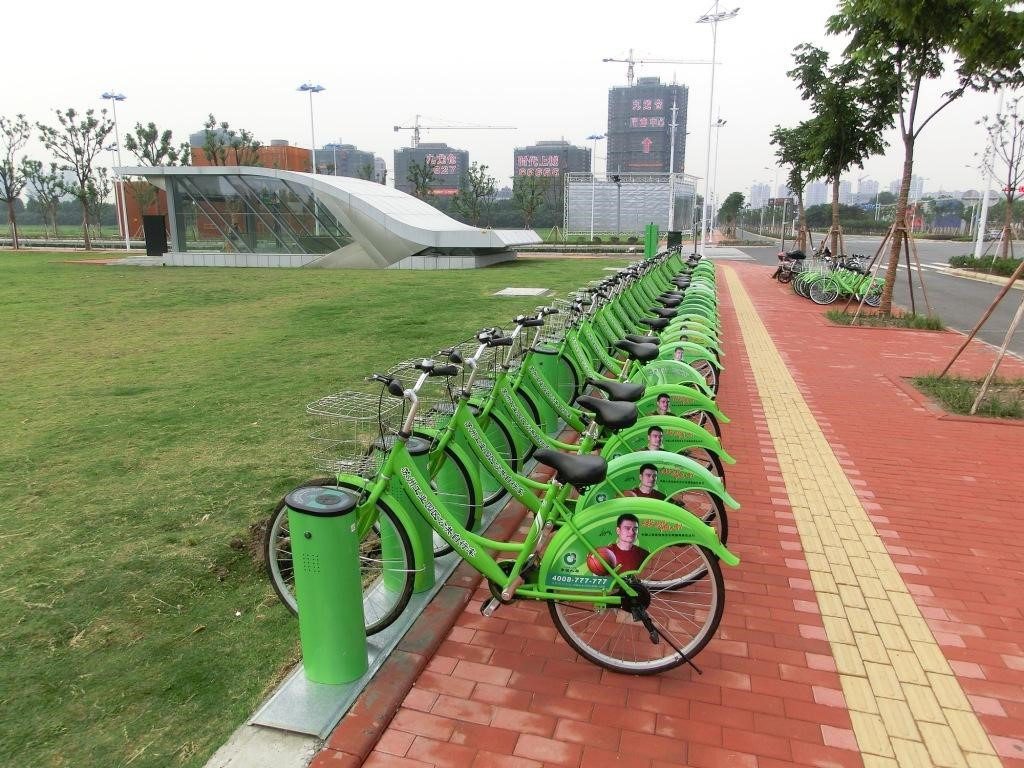
As for Suzhou Public Bike System (SPBS), it is a third generation bike-share system located in Suzhou – a major city (2,743 km2, 6.7 million population) located in East China. SPBS is operated by a private company Youon, under the supervision of Suzhou Urban Management Bureau (SUMB) – a local bike-share administration authority. It was first launched on August 30, 2010, with only 11 stations and 200 bikes. Currently, over 2,200 SPBS stations and 41,000 fleets are distributed all over the city. The average daily ridership of SPBS is more than 0.2 million in 2016, namely each SPBS bike used 4.7 times/day. SPBS contributes 0.32% of the overall transport modes.
Distribution of SPBS stations in Suzhou
Notes:
1. drag and scroll a mouse wheel to zoom in and out to search different areas
2. color:
Red circle – areas with stations >100
Yellow circle – areas with stations between 10 and 100
Green circle – areas with stations < 10
Access to SPBS was initially available to people who registered for a membership card. In 2016, Youon upgraded the system to allow smart phone access, so users can register, check in and out and receive information through an APP without a card. To some extent, it makes SPBS a third-half generation BSs.
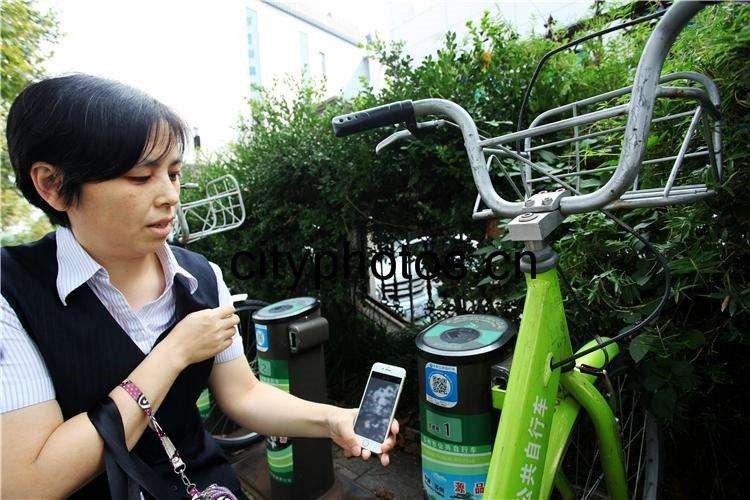
Note: A lady is trying to unlock the bike using an app
For SPBS charging policy, the deposit is USD 30 for card registrations and free for APP registrations. The first hour’s ride is always free followed by USD 0.15 /h. No extra subscription fees or membership fees are needed. The financial requirements to gain access to the system are easy since cycling users are encouraged and subsided by government. Compared to western bike-share systems, great advantages could be seen in SPBS. See the following table.
|
City |
London |
Paris |
Washington,D.C |
Suzhou |
|
County |
U.K. |
France |
USA |
China |
|
System Name |
Barclays Cycle Hire |
Vélib |
Capital Bikeshare |
Suzhou Public Bicycle |
|
Start Date |
July,2010 |
July,2007 |
September,2010 |
May,2010 |
|
Stations |
750 |
1,800 |
200 |
2200 |
|
Bikes Number |
11,000 |
23,900 |
1,800 |
41,000 |
|
Free Hire |
0.5h |
0.5h |
0.5h |
1 hour |
|
Deposit |
N/A |
$199 |
$202 |
$30 |
|
Subscription Fees |
Daily:$3 |
Daily:$2 |
Daily:$7 |
0 |
|
Usage Fees |
0-0.5hour: free |
0-0.5hour: free |
0-0.5hour: free |
0-1h: free |
|
Trips per Bike Per Day |
3.1 |
10 |
2.4 |
4.7 |
Part Two: what do trip data tell us about SPBS
By using dataset provided by SUMB, we are able to get access to over 30 million SPBS trip records, which covers all 2,256 stations in Suzhou from June 1, 2016 to May 31, 2017. By analyzing this big data, tempo-spatial distribution, users’ characteristics and behaviors could be revealed.
Usage of SPBS in a random working day
Firstly, by dividing the picking up and returning activities, we could see how SPBS usage changes in a random working day in 24 hours in a city-scale. Two peak hours from 7 to 8 am and from 5 to 6 pm could be observed with unbalanced spatial distribution—— more pick-up activities could be observed in certain areas while other areas with more returning activities in peak hours.


Notes:
1. Every dote indicates a SPBS station
2. Different color means different numbers
3. Time can be seen in top left
SPBS trips dynamic assignment in a given weekday in a whole day
Since cycling in all SPBS stations can be tracked, a stations matrix is built up so that all the cycling trips could be assigned to existing road network. This following video shows how SPBS trips are assigned to road network in a random working day. A complete road network with all the public bike stations is built up and the assignment process is optimized so that cycling trips only exist in urban streets rather than expressways and freeways. Densest trips could be seen in roads in SIP, SND.
[jwp-video n=”1″]
Notes:
1. line width indicates trips numbers, thicker lines mean more bike trips
2. Time could be seen in bottom right
Average travel time by age and gender
Profiling method is used to analyze users characterizes. In the following two figures, trips from Jun 2016 to Jan 2017 are aggregated and trip time is distributed monthly in terms of different groups (by age and gender). It turns out that
young group (18-34 years old) and male group favor public bike more than other groups, while 5 min is the most popular trip time.
Notes:
1. legend is on the right, four age groups are divided
2. move the mouse on the figure and details would show out
3. Y-axis is ratio and X-axis is trip time.
Weekly trip frequency distribution by age
The following figure displays the weekly frequency of SPBS users in different age groups. Most people travel less than two times in one week – and younger the user are, more often they use public bikes.
Notes:
1. Legend is on the right, four age groups are divided
2. Move the mouse on the figure and details would show out
Year-trip distribution by age
This visualization shows that the total number of trip times of each month in different age groups from June 2016 to May 2017. People aged between 18 and 54 are the major user group of public shared bikes in Suzhou. In addition, the usage frequency of SPBS varies in different quarters. It indicates that the temperature and other environmental factors have a significant impact the usage of shared bikes. – for instance, in Jan and Feb (normally Spring Festival holidays), SPBS usage was greatly fluctuated and influenced.
Tips:
1. Legend is on the right, four age groups are divided
2. Move the mouse in each month line to see the detailed information
Access methods and users’ preference in a year
From 2016, users are able to get access to public bike system by scanning QR code through smart phone, which offers a convenient way to use public bike system. In this visualization, total trips grouped by two access methods (traditional smart card and QR) are given.
Big jump of QR users clearly indicates users’ preference on convenience.
Notes:
1. Legend is on the top right
2. Drag the bar at the bottom left and right to move horizontally to look close a chosen span
Access methods and users’ preference in a week
Two types of users (QR users and smart card users) are indicated and compared in a random working day in this figure. Interestingly, more people use smart card in the morning peak hour while scanning QR is more popular in night peak hour.
Notes:
1. Legend is on the right
2. Press play to watch how different access methods works in each day in a week
Part Three: What happened when Metro meets Bike-share
Metro Line 4 (known as the M4) is the third metro line operating in Suzhou which runs from the north (Xiangcheng District) to the south (Wuzhong District) crossing through the central area. It was opened on 15th April 2017 while the SPBS dataset spanned from June 1, 2016, to May 31, 2017, namely, trip dataset offers time windows to measure changes of SPBS before and after the metro opened. We selected 84 SPBS stations alongside M4 to see how metro influenced SPBS usage.
Changing rate of trips caused by M4
Ridership is found to soar greatly after the M4 was introduced, as the city-level SPBS trips increased from 3.6 million to 5.34 million at a rate of 148.1% from March to May. Not surprisingly, alongside M4, the chosen stations witnessed greater increase at a rate of 190% as can be seen in following figure.
Note that larger increase in weekend trips compared to weekday trips at both city-level and selected stations means the new metro may have triggered more leisure cycling than commuting cycling.
Interestingly, the average travelling times declined from 17.2 mins to 15.9 mins at the selected stations while increased in a city-level. This is logical proof of how transit and bike-share combine. In SPBS stations accompanying the M4, cycling time was reduced because an interchange has been introduced, in the form of the metro, into what was once a total cycling trip.
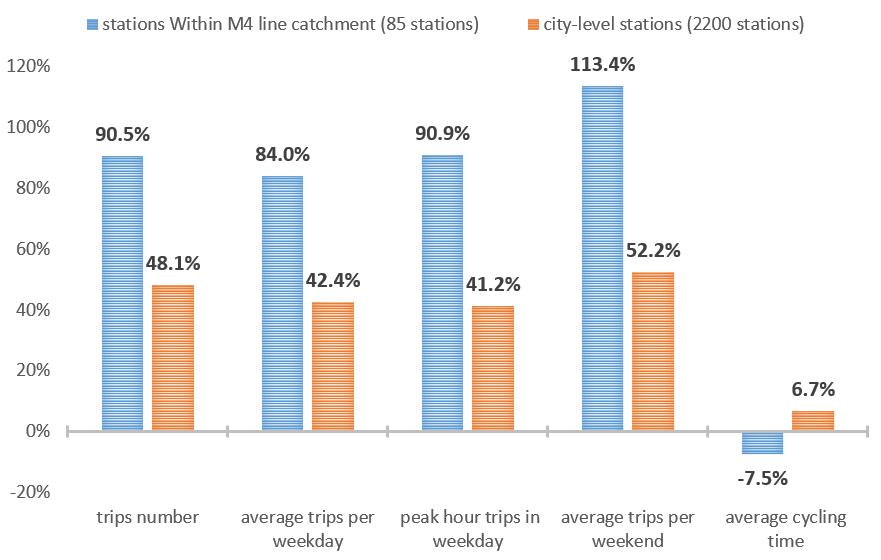
Notes:
1. Legend is on the top
2. The numbers above the bar indicates the changing rate of cycling times
Ridership change alongside M4
The following figure shows how trip number changes when M4 is introduced. Basically, most of the stations witnessed a increasing rate after M4 operated.
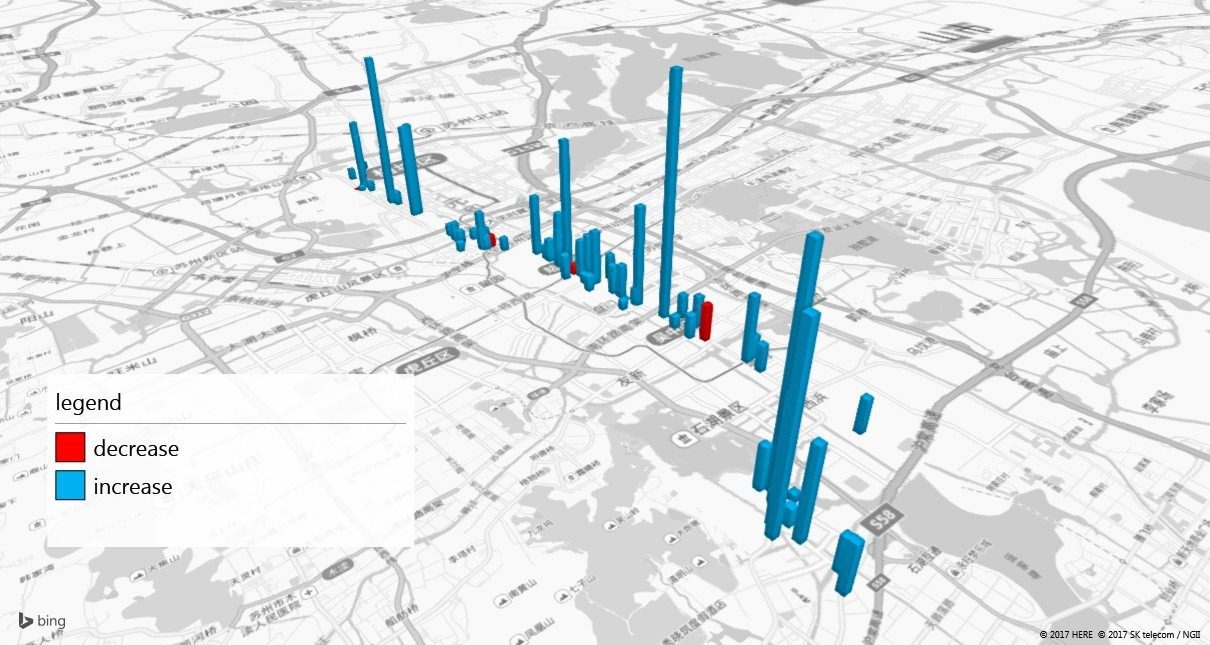
Notes:
Blue bars mean increasing rate of trip numbers in particular stations while the red means decrease. The higher, the greater change
Patterns change caused by M4
By analyzing and clustering trips in stations alongside M4 by k-means algorithm, two major types of trip patterns are revealed. They are called “balanced pattern” and “imbalanced pattern”. If a station has similar borrowing and returning number of bikes in most of the time, they are defined as “balanced pattern”, otherwise, they behave “imbalanced pattern”.
A typical balanced M4 station (Beisita)
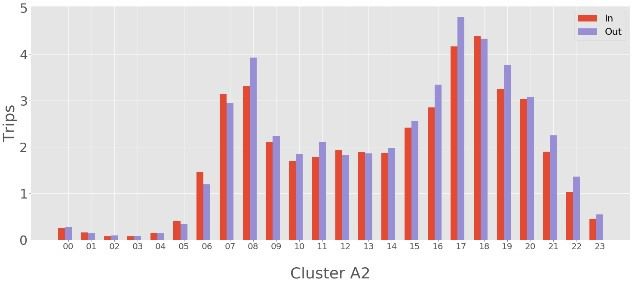
Notes:
1. Red bar indicates returning bikes while blue indicates borrowing, they are almost the same
2. X-axis is time vector and Y-axis is returning/borrowing times
A typical imbalanced M4 station (Huolidao)
The pre- and post- patterns of trips were then compared since correspondent type categories are already set, see the following Figure. A changing pattern from balanced to imbalanced (higher number of arrivals in the morning and higher number of departures in the evening) is commonly observed.
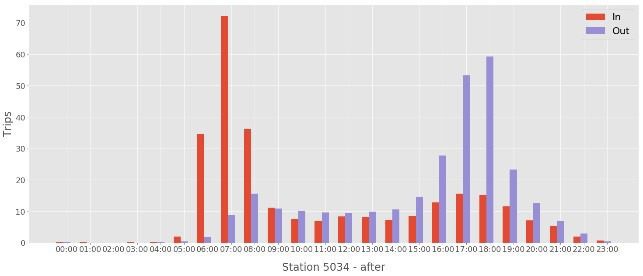
Notes:
1. Red bar indicates returning bikes while blue indicates borrowing, they are almost the same
2. X-axis is time vector and Y-axis is returning/borrowing times
Patterns changed due to M4
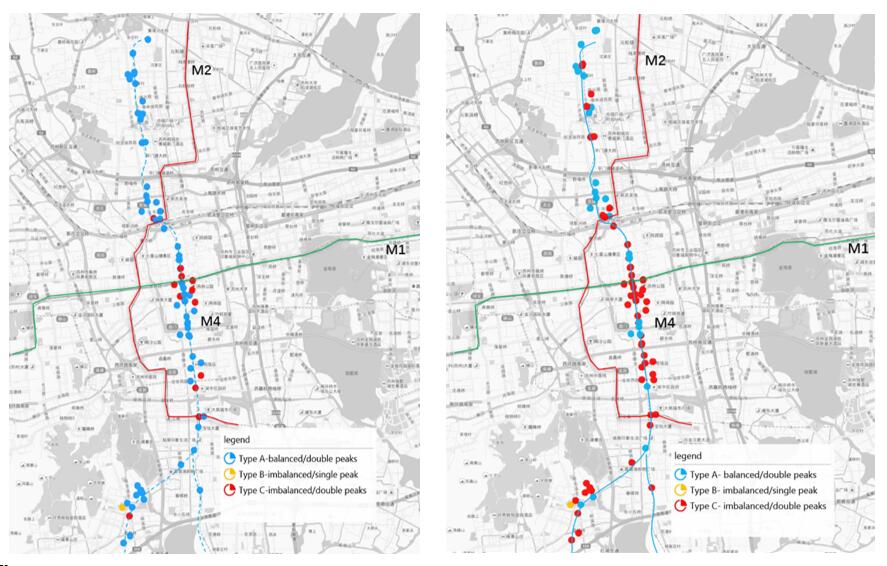
Tips:
1. Left figure is station patterns before M4, right figure is how it changed after M4
2. Blue circle indicates SPBS stations with balanced patterns while red indicates imbalanced ones
Some interpretation and possible reasons behind
A changing pattern from balanced to imbalanced (higher arrivals in the morning and higher departures in the evening) along with increasing trips might be understandable in residential areas since people tend to cycle to “arrive” at metro stations and “depart” from there. However, this also happened in mixed-use areas, where it was assumed people would have “arrived” on the metro and used shared bikes to “depart” to their work places, resulting in high borrowings (departure). To the contrary and beyond expectation, the result of post-M4 clustering analysis suggests higher arrivals occur in mixed-use areas within core urban areas.
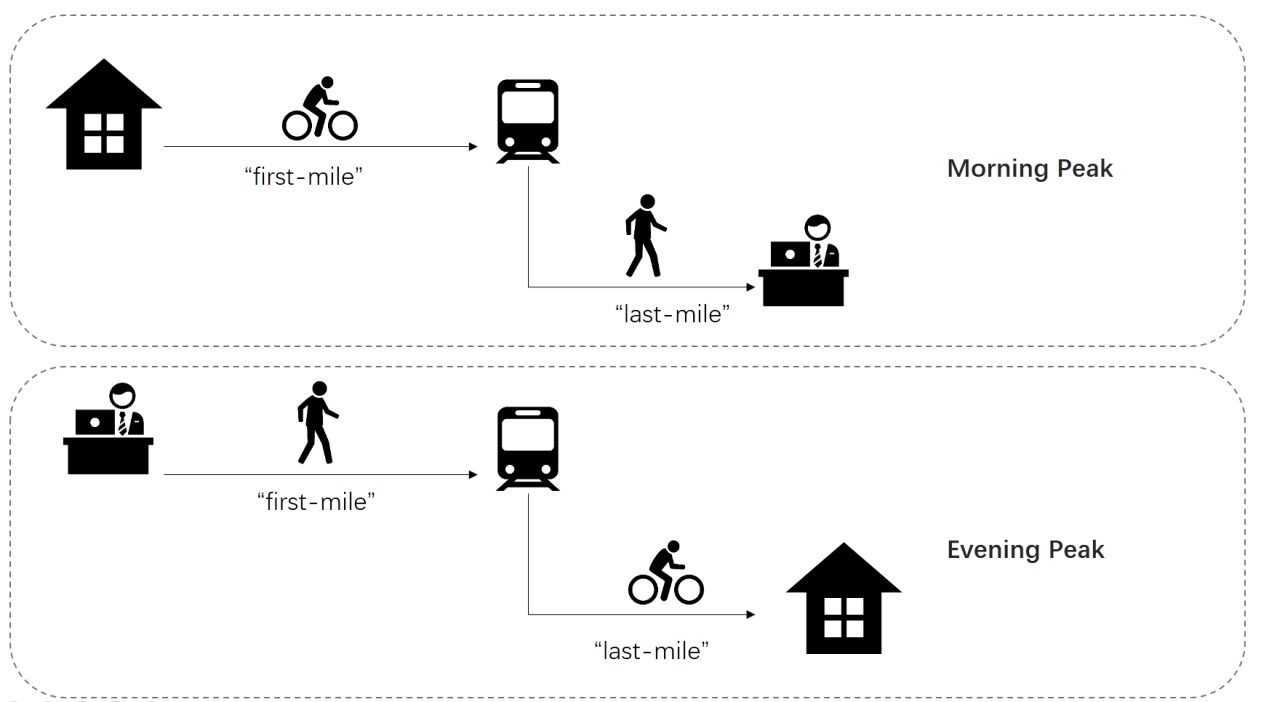
This phenomenon might be interpreted as more people cycling to the metro interchange from their homes rather than cycling to work places from the metro during the morning peak and vice versa in the evening, as seen in following Figure . In other words, the SPBS mainly serves as “first-mile” in the morning and “last-mile” in the evening on working days. Abundant, convenient interchanges available in core urban areas might be one of the reasons. Another reason might be the issue of rebalancing bikes at stations, returning bikes and the amount of walking. For example, when a traveler departs from a metro station and has to walk a while to rent a shared bike, he has to take the risk that the BSs station might be empty, and he has to walk further to reach another station.

Users changed due to M4
Three stations were selected to further investigate both the trip and user changes in a micro perspective. These three cases are chosen since they are in different yet typical land use patterns.
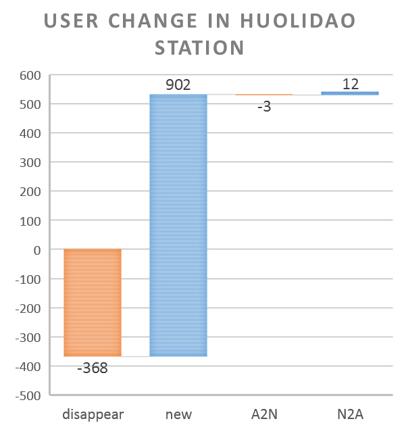
Huoli Dao station (ID 5034) is located among a large residential block in northern Suzhou, a relatively remote area right next to an entrance of an M4 station. The surrounding land use is mainly residential. After the M4 began operation, more than 900 new cyclists appeared while 368 users disappeared in almost a month. It is hypothesized that while some former users turned to the metro directly, most of the new users were attracted to the M4 by using shared bikes.
Tips:
1. blue circle indicates SPBS stations with balanced patterns while red indicates imbalanced ones
2. left figure is before M4, right figure is after M4
3 new users: new (active) BSs users.
casual users: active BSs users become casual users.
disappeared users: former BSs users have no usage records any more, which means they have stopped using the BSs
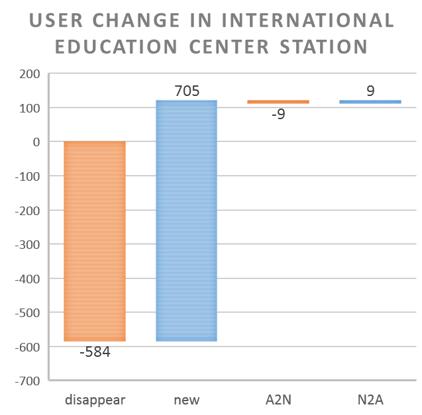
The International Education Center station (ID 2306) locates among a large block of education facilities. The land use is solely for education. After introduction M4, some former users abandoned the SPBS while slightly more new users began to use shared bikes (584 vs 705) as shown in Figure 15. This indicates that the M4 has triggered and attracted a growing number of new SPBS users.
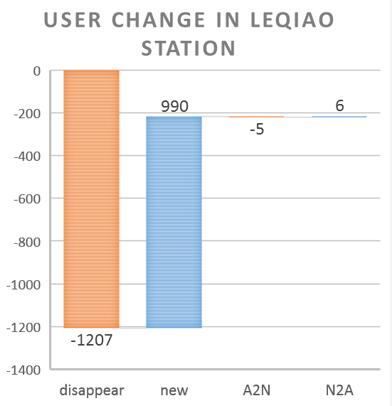
Le Qiao station (ID 87) locates in the heart of Suzhou, the center of the old town comprising mixed land use and a commercial center nearby. Note that it is located near the M1 that began operation 4 years earlier than the M4. The shift in users is particularly interesting at this station, where over 1,200 users abandoned the SPBS while almost 1,000 new users emerged once the M4 began operation. The absolute numbers from both sides are shown in following figure. Maybe the new metro (M4) substituted cycling in core urban areas as Martin and Shaheen (2014) described in two cases in the USA.
Comments are closed.