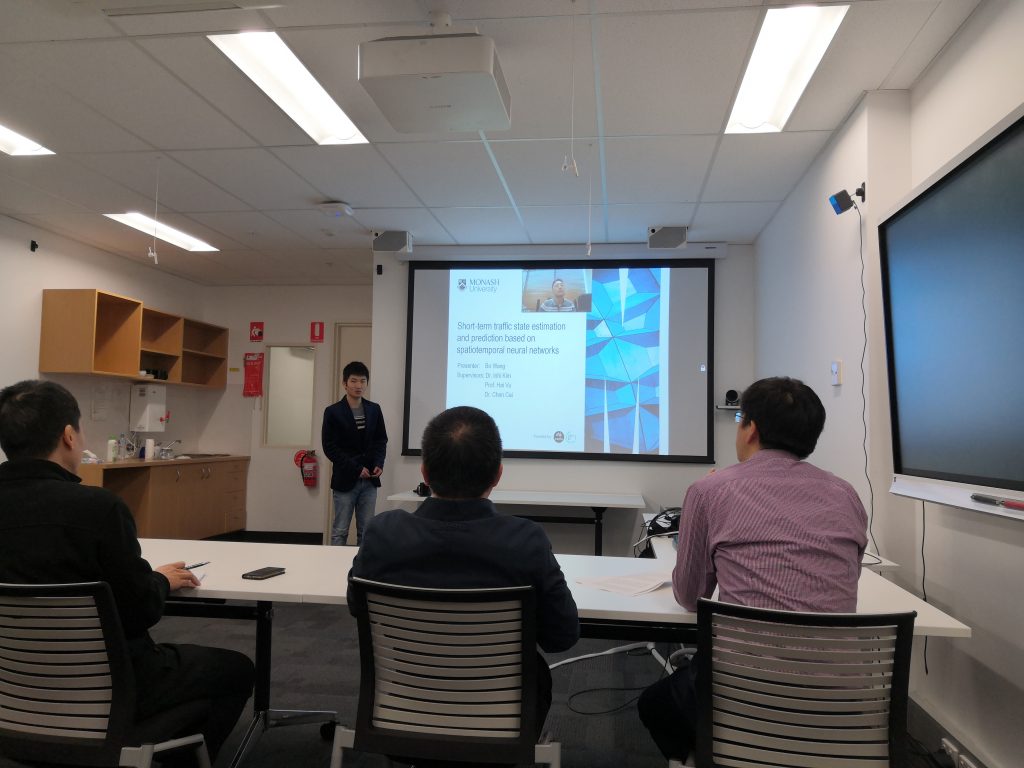
Congratulation on Bo’s confirmation. All the panels and the chair impressed Bo’s research progress. The presentation was also very comprehensive. If anyone needs the seminar in a video file please contact me. Well done Bo!!
Title: Short-term traffic state estimation and prediction based on spatiotemporal neural networks
Research Theme: Monitoring, Prediction and Protection
Group: Transport
Summary: Spatiotemporal neural networks (NN) models have recently achieved competitive results for short-term traffic prediction and achieved outstanding outcomes. However, two problems still require further study in terms of model performance and inner mechanism understanding: (1). The forecasting model affected by many aspects like model inputs, model structure, external factors, and optimisation function. How to design an appropriate framework for short-term traffic state prediction? (2). The existing related studies mainly use the knowledge and advantage from the neural network field, but how to incorporate transport domain knowledge with the above framework? Therefore, th e aims of this study are: (1) Presenting an overall framework from data management to model training for traffic network state estimation and prediction, which provides better forecasting results and APIs for other applications. (2) Understanding the relations of components inside the framework and improving it by integrating transport domain knowledge. The preliminary works of this study focus on the inputs and structure of NN-based model, which used the datasets of bike-sharing traffic network (New York and Suzhou cities) and highway traffic network (PeMS – Caltrans Performance Measurement System). The main outcomes are (1). The impact and inner relation of the external factors (discrete variables like weather, POI, and holidays) are studied. (2). A more accurate forecasting model based on 3D residual NN is presented, which learning the spatial-temporal features and being trained with traffic correlated input data with temporal autocorrelation. (3). The advantage of model fine-tun ing (a technique of transfer learning in the NN field) is studied with PeMS dataset, which has improved the model with limited training data. In the future work, more complex input and output data (network level) will be considered. Since traffic flow, density, and speed are essential factors in traffic flow theory; therefore, further studies will aim to integrate more domain knowledge to guide the model training. Transportation is fundamental to a thriving society. The results of short-term traffic forecasting affect both decision support of city planning and traffic management. The outcomes of this study provide a general framework of the NN-based traffic forecasting model for practice and a better understanding, which will benefit the short-term traffic forecasting related research and industry.
Bio: Bo Wang received the double M.S degree in transportation engineering from Monash University and Southeast University in 2018. He commenced his PhD at Monash University in 2018 under the supervision of Dr. Inhi Kim, Prof. Hai Vu and Dr. Chen Cai. His research interests include intelligent transport systems, deep neural networks and big data mining in transportation.
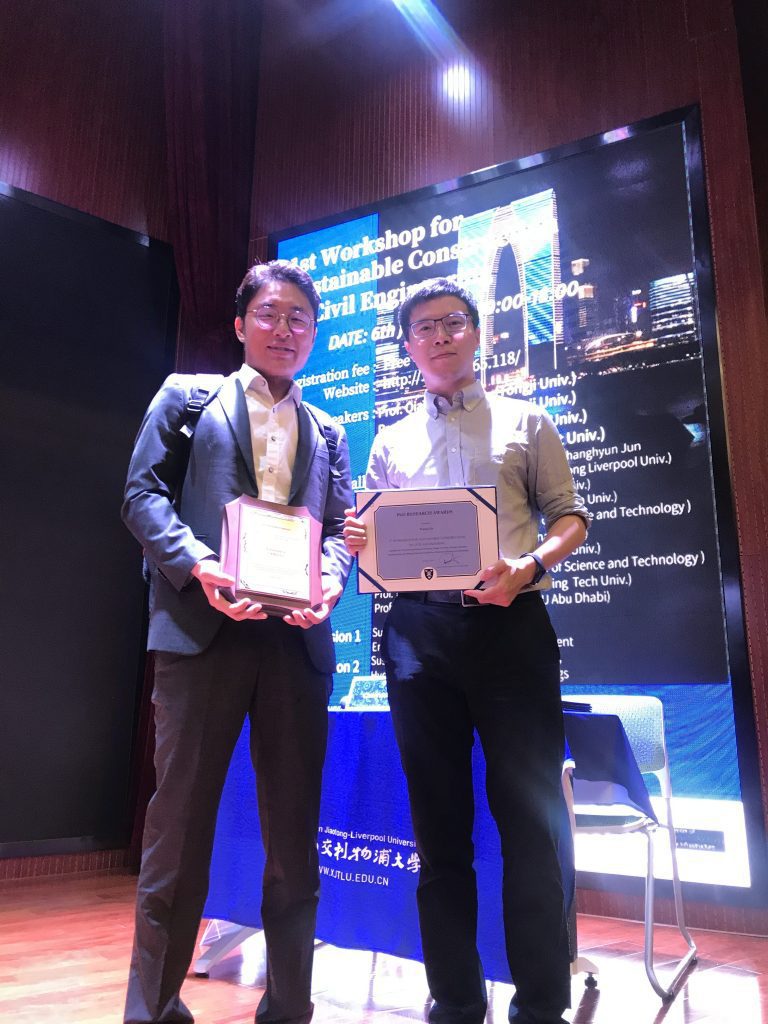
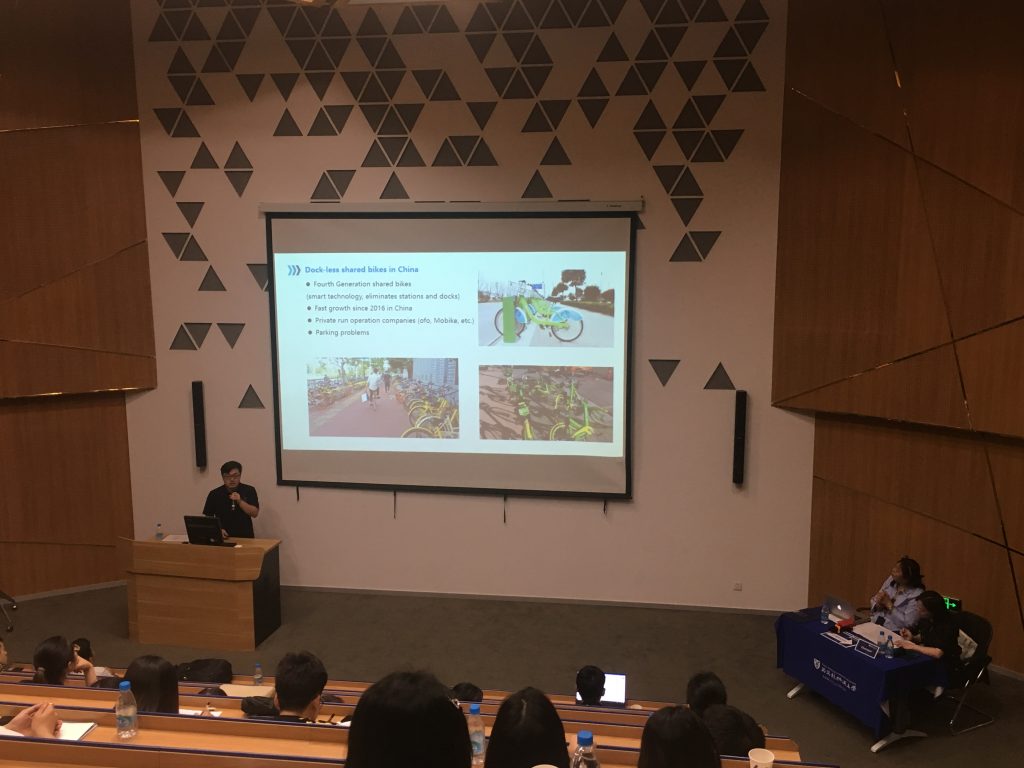
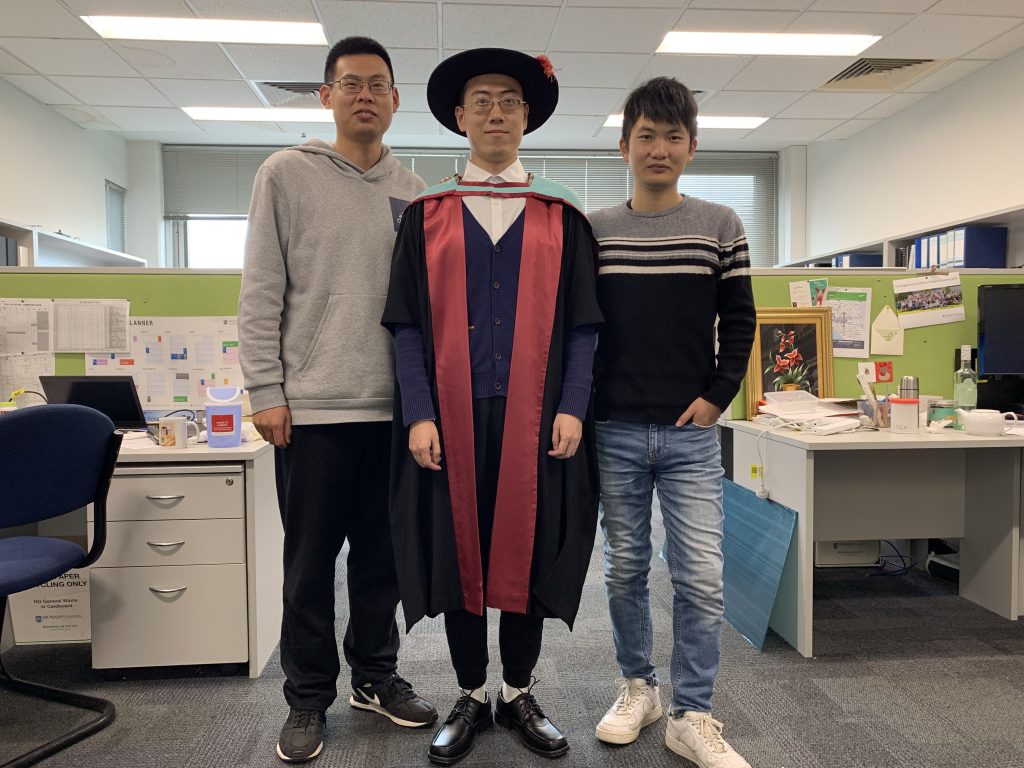
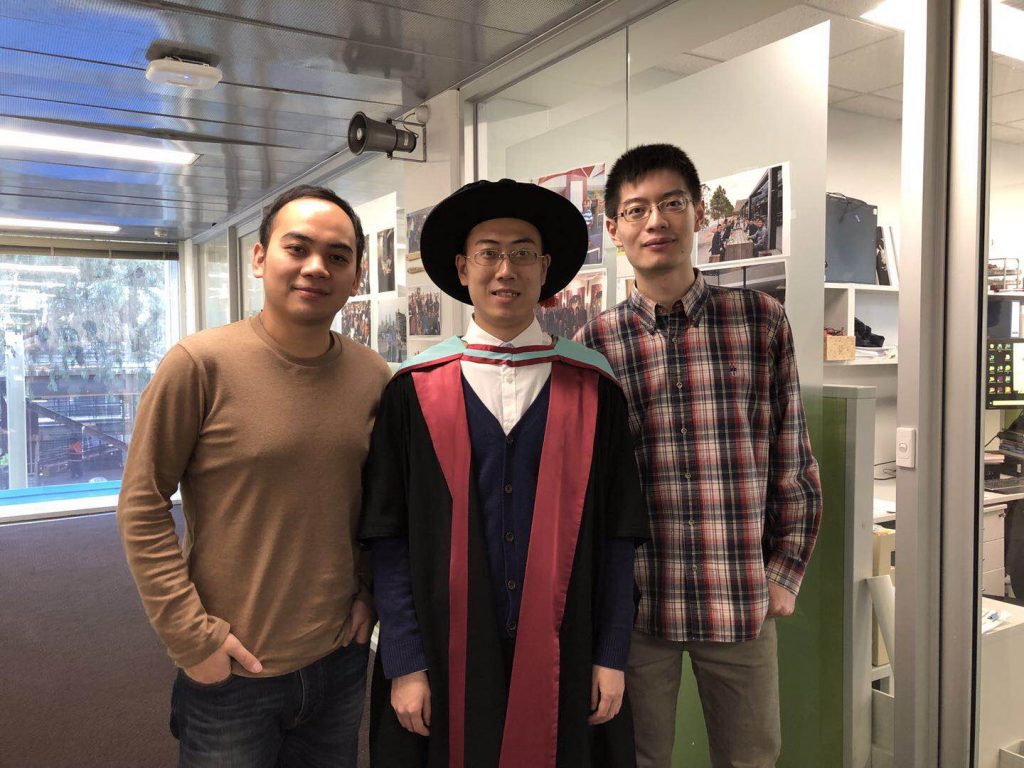
I am pleased to inform you that my phd student, Tianqi Gu won the best phd research award from the 1st Joint Workshop held in Xian-Liverpool University, Suzhou. Also our phd candidates (Taeho and Dong) made a wonderful presentation today.
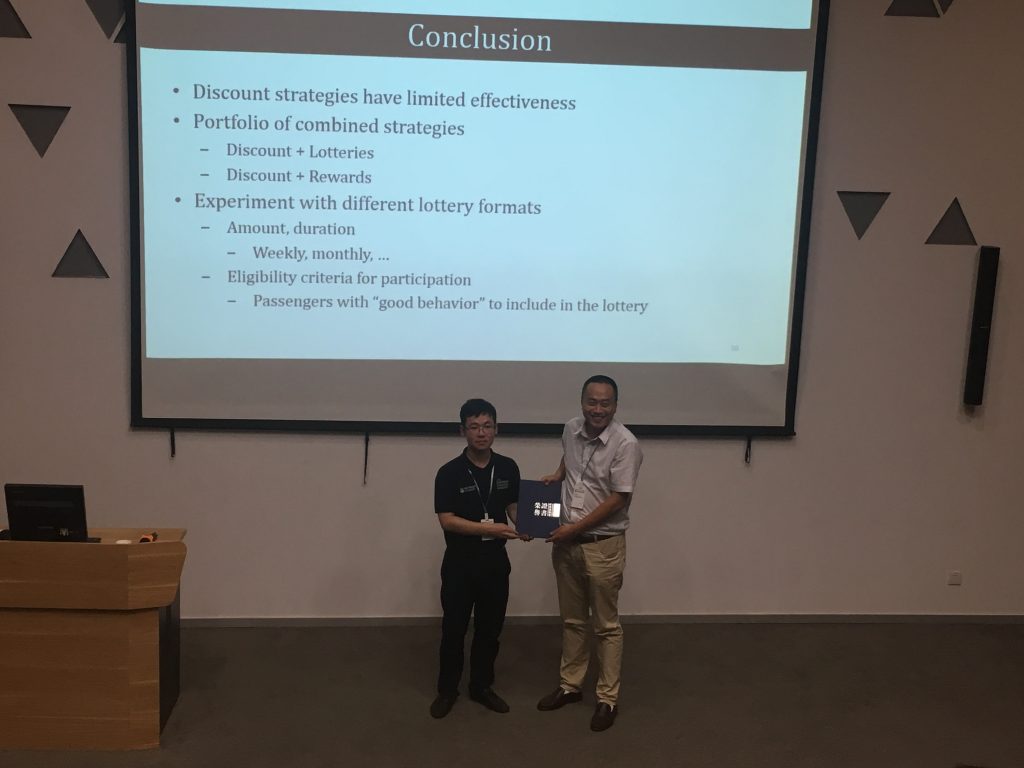
Dr. Mike Ma gave an invited talk to the audience about smart operation of public transportation.
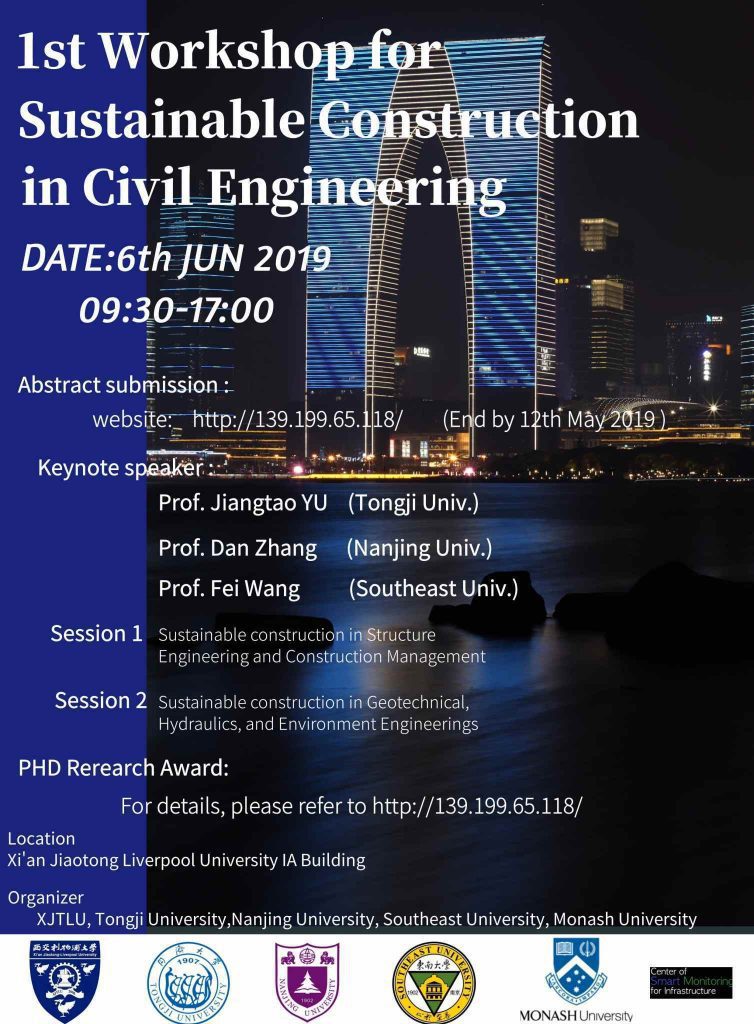
Local universities including, Liverpool University, Southeast university, Nanjing university, Tonji university and Monash university invites to the 1st workshop for sustainable construction in civil engineering on 6th June 2019.
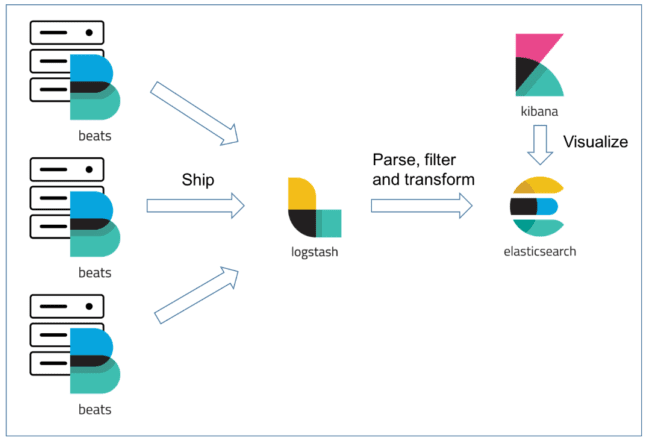
The dashboard below was developed through Elastic open source software using the Seoul metro passenger flow data in 2014.
Data visualization has been important in democratizing data and analytics and making data-driven insights available to workers throughout an organization. Data visualization also plays an important role in big data and advanced analytics projects. As a transportation field accumulated massive troves of data during the early years of the big data trend, they needed a way to quickly and easily get an overview of their data. Visualization tools were a natural fit.
Visualization is central to advanced analytics for similar reasons. When advanced predictive analytics or machine learning algorithms are available, it becomes important to visualize the outputs to monitor results and ensure that models are performing as intended. This is because visualizations of complex algorithms are generally easier to interpret than numerical outputs.
In TUPA, we utilized one of the strongest searching engines called Elasticsearch to make this visualization works. The flowchart below shows the process to deal with big data and visualize it.
We utilized TurtleBot3 which adopts ROBOTIS smart actuator Dynamixel for driving.
TurtleBot3 is a ROS-based mobile robot. We customized it to reconstruct the mechanical parts and use optional parts such as the computer and sensor. SLAM, Navigation and Manipulation, makes it to build a map and can drive around the room. Also, it can be controlled remotely from a laptop, joypad or Android-based smart phone.
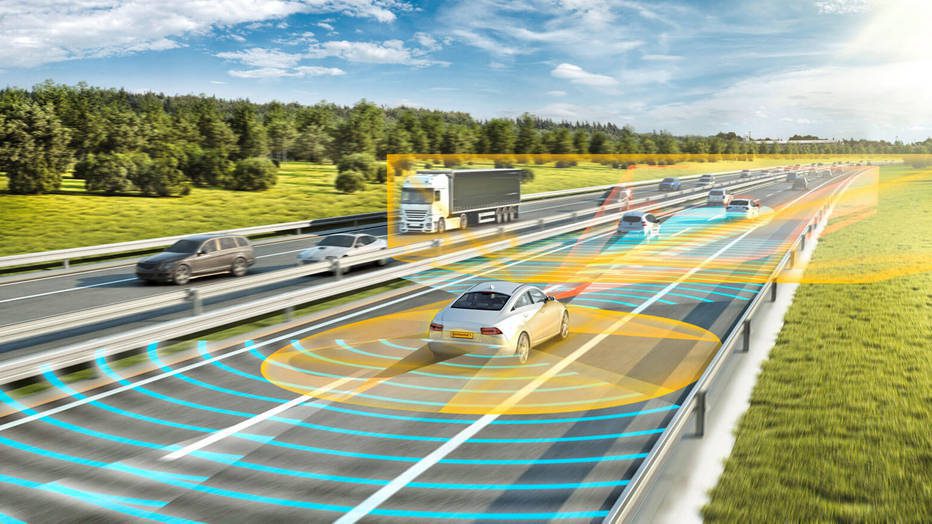
The project allows the robot to detect the lane(s) and obstacles to avoid. Various algorithms such as SLAM, CNN, LSTM and OpenManipulator are embedded in the robot to make better robot behavior.
The following video demonstrates the navigation function.
Big congrats for Wenhua’s Faculty of Engineering Graduate Research International Travel Award!! Wenhua will visit Prof. Haris Koutsopoulos’s group at Northwest university, the US for 6 months.
To provide empirical evidence on the relationship between built environment and public sharing bike flow in Suzhou, China.
Research Objectives
To examine the global impacts of built environment on public sharing bike flow.
To understand the effects of spatial variation of those built environment on public sharing bike flow
Study Area
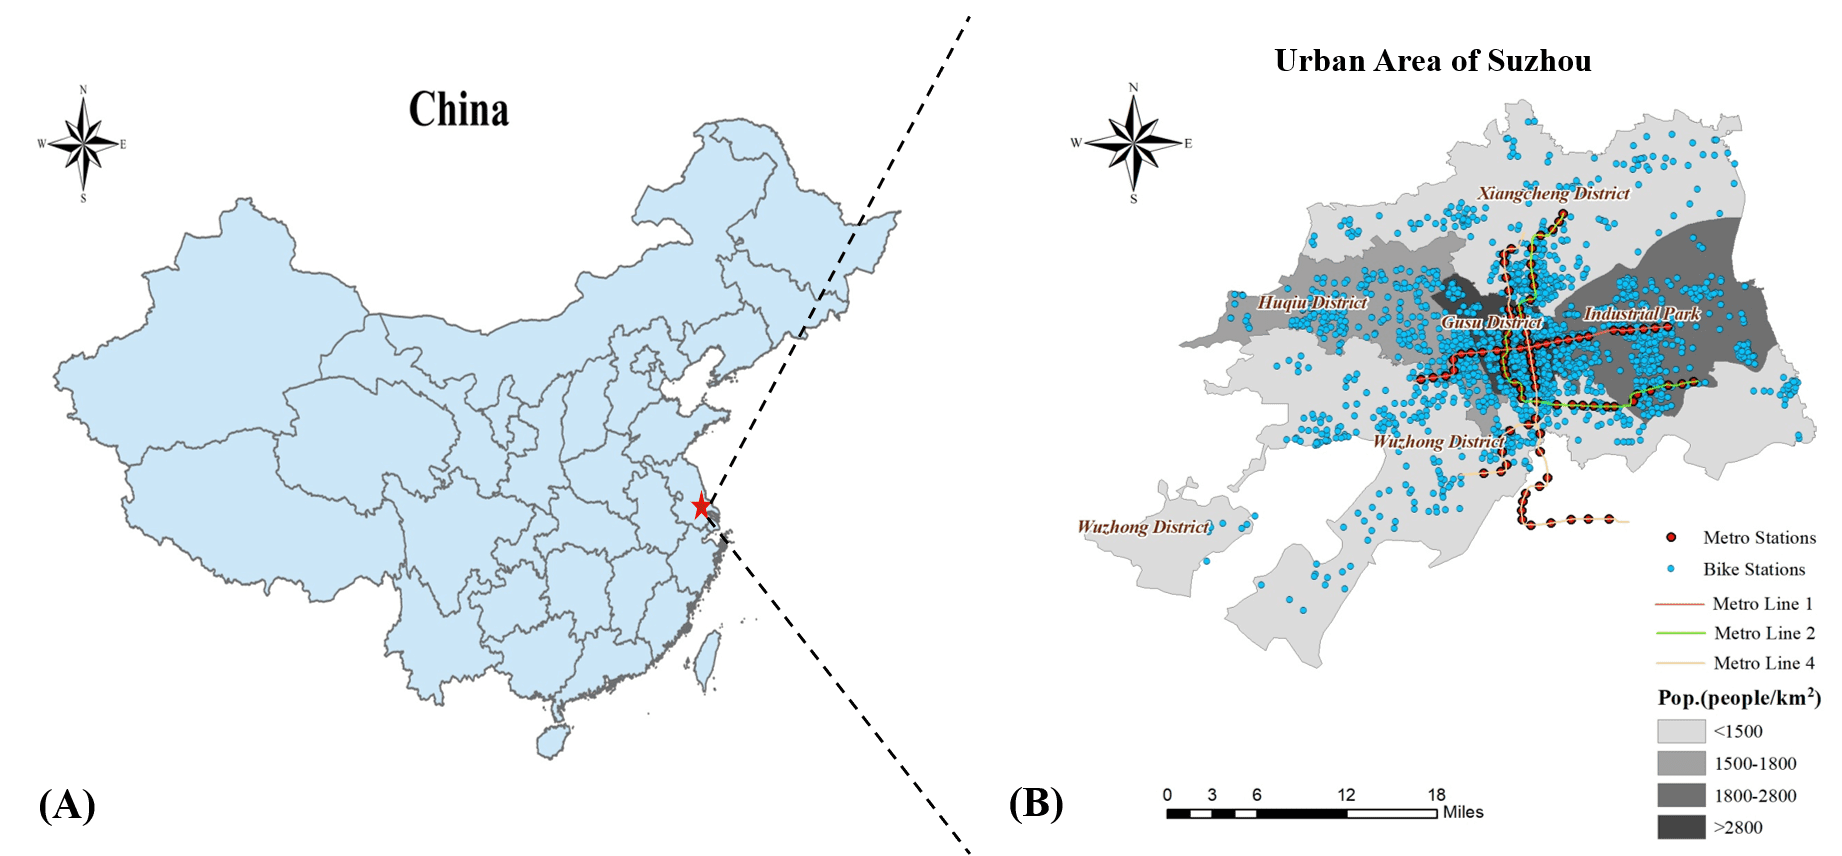
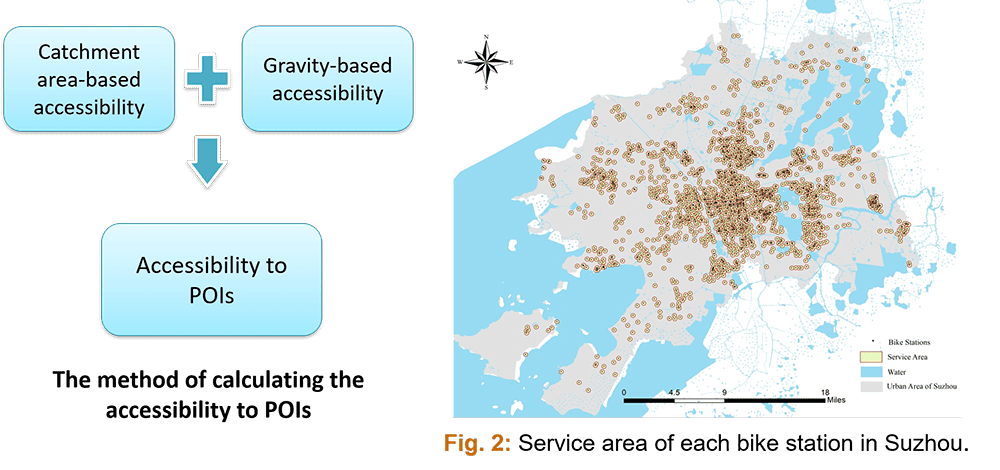
The study area of this research focuses on Suzhou located in the southeast Jiangsu Province of East China and east about 100 km to Shanghai (Figure 1(A)).
There are around 1,750 bike stations and 40,000 public sharing bikes put into use in Suzhou (Figure 1(B)).
Fig. 1: Study area. (A) Location of Suzhou in China; and (B) the spatial distribution of bike stations, metro stations and population density in urban area of Suzhou.
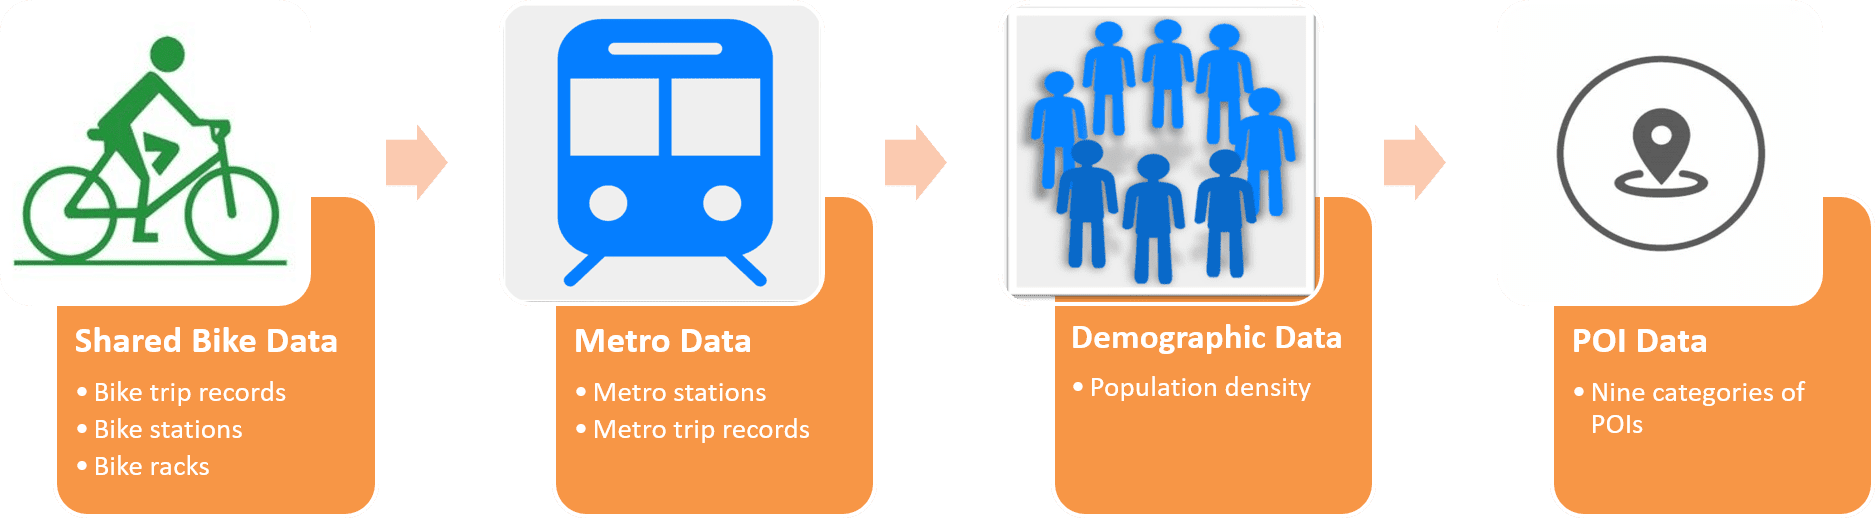
Data
Data Sources
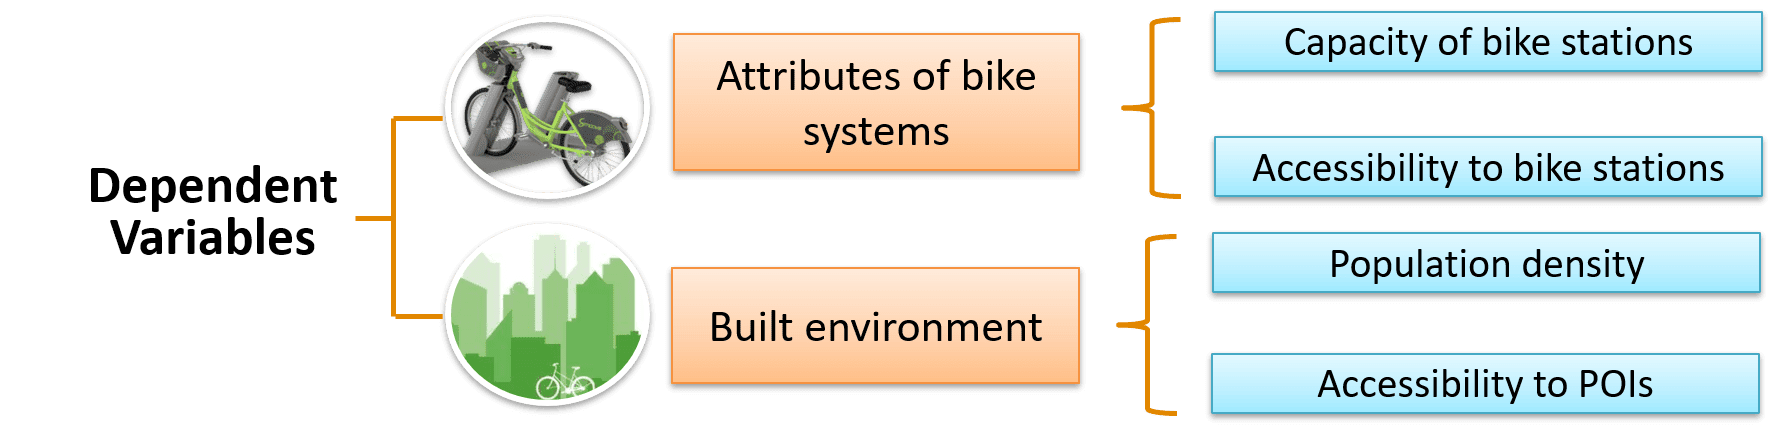
Operationalization of Variables
Methodology
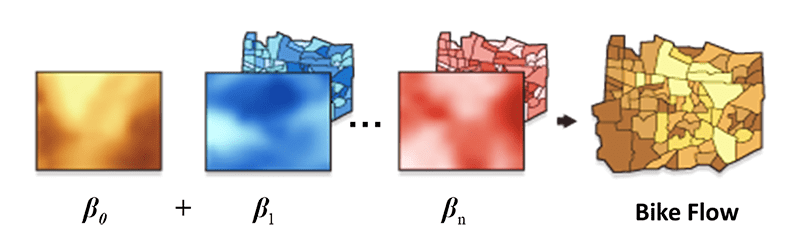
Global Regression
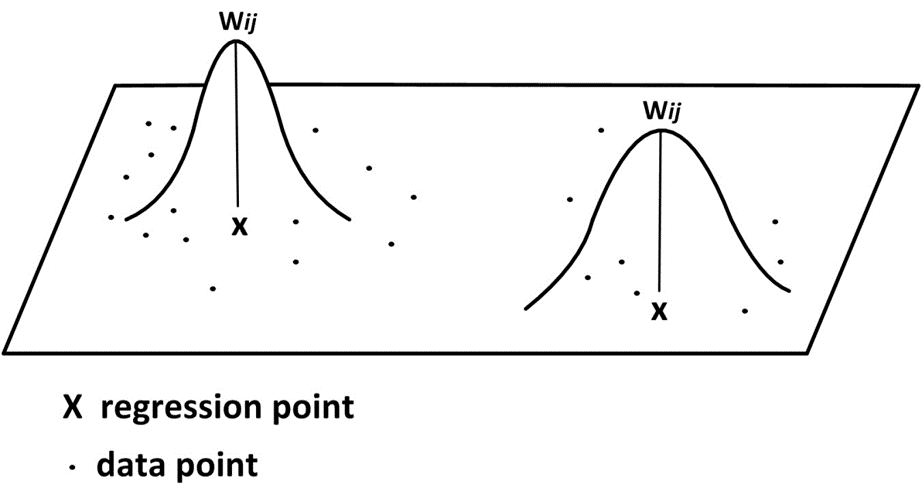
Geographically Weighted Regression (GWR)
GWR is a local regression model. Coefficients are allowed to vary.
Bi-squared Weighting Function
Results and discussions
Global Regression
Table 1: The results of Global Regression.
Dependent variables
Global Regression
Trips on workdays
Trips on nonwork days
Coeff. (t-value)
Coeff. (t-value)
Intercept
-75.388 (-8.27)
-67.948 (-7.25)
Attributes of public bike systems
Capacity of bike stations
3.508 (11.88)
3.372 (11.11)
Accessibility to bike stations
33.441 (14.66)
27.991 (11.93)
Built environment
Population density
-2.2E-04 (-2.13)
-2.2E-04 (-2.00)
Accessibility to metro station
4.852 (5.83)
3.803 (4.44)
Accessibility to shopping mall
8.254 (4.23)
10.003 (4.99)
Accessibility to bus station
6.719 (3.23)
6.054 (2.83)
Accessibility to restaurant
1.075 (5.82)
1.491 (7.84)
Accessibility to dwelling
0.544 (0.49)
0.411 (0.36)
Accessibility to local financial services
11.608 (6.84)
11.494 (6.59)
Accessibility to public leisure and religion place
-3.258 (-2.22)
-0.906 (-0.60)
Accessibility to public park
-7.613 (-1.22)
-1.131 (-0.18)
Accessibility to educational place
7.276 (3.83)
9.130 (4.68)
Accessibility to workplace
5.190 (3.78)
-1.610 (-1.14)
R-square
0.392
0.360
Adjusted R-square
0.387
0.355
Note: Values in bold are significant at 0.1 level.
Geographically Weighted Regression (GWR)
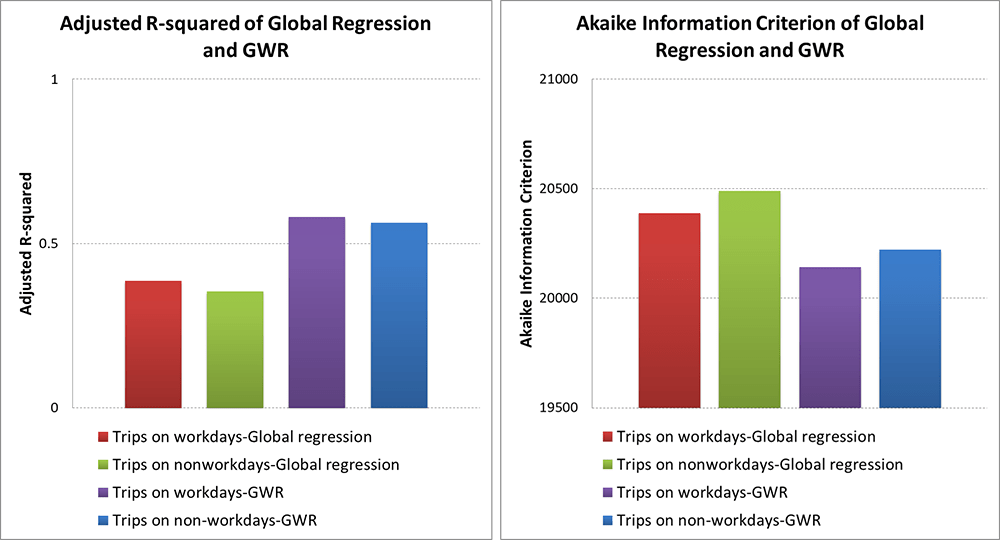
Fig. 3: Comparisons of explanatory power of Global regression and GWR.
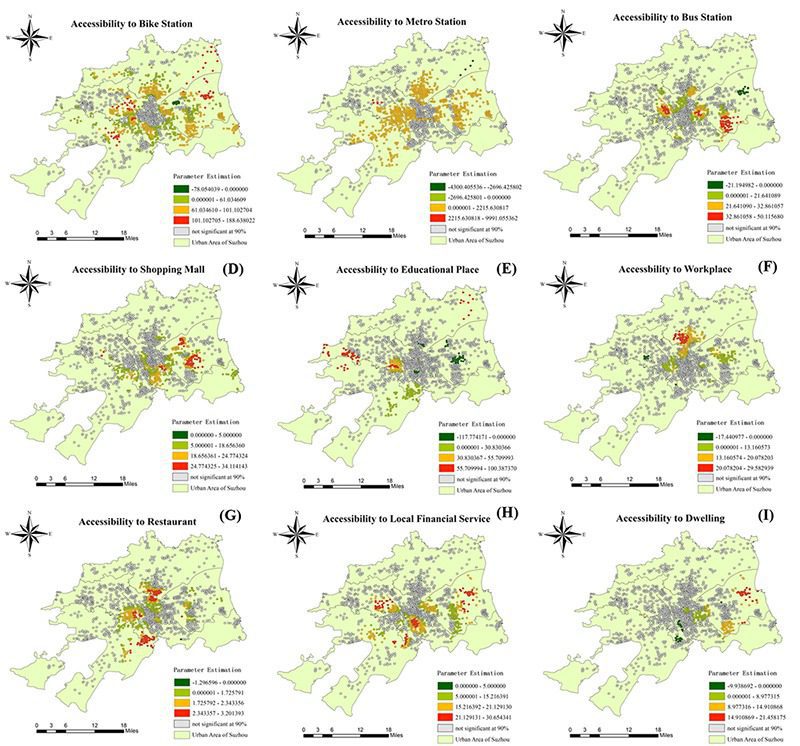
Fig. 4: Spatial distributions of local coefficients on working day and t-value with significance less than 90%.
Conclusions
Global Regression
GWR
The capacity and proximity of bike stations are positively correlated with bike usage.
Gravity-based accessibility to metro stations of bike stations may increase bike flow.
The bike stations nearby shopping malls, bus stations, restaurants, financial and educational places are also positively correlated with bike usage.
Population density has a statistically negative impact on bike usage.
The effects of built environment are divergent across the Suzhou region.
Most of the coefficient appears to have zero or negative value in the central areas of Suzhou (Old Town) while surrounding areas have modest built environment effect on bike flows.
The goodness of fit in the GWR is better than the global regression model.
Acknowledgements
This work was supported by Jiangsu Industrial Technology Research Institute and Research Institute of Future Cities at Xi’an Jiaotong-Liverpool University.
For more detailed information please contact our TUPA members below;
Chunliang Wu, [email protected]
Transportation data is of great importance for intelligent transportation system. Missing data problems are inevitable during data collection.
Challenges in existing imputation methods: potential useful information is not efficiently used in the modeling process; methods considering temporal correlation usually assuming that linear relationships exist between observed variables and latent variables; most techniques fail to measure the uncertainty.
This study introduces the use of a self-measuring multi-task Gaussian process (SM-MTGP) method for imputing missing data.
CONTRIBUTIONS
A SM-MTGP method is proposed to combine features from tasks and inputs to measure similarities jointly.
Dependencies of tasks and inputs are explored via covariance functions under SM-MTGP framework.
Correlations between responses are captured to provide additional information for enhancing imputation accuracy.
METHODOLOGY
Brief review of MTGP
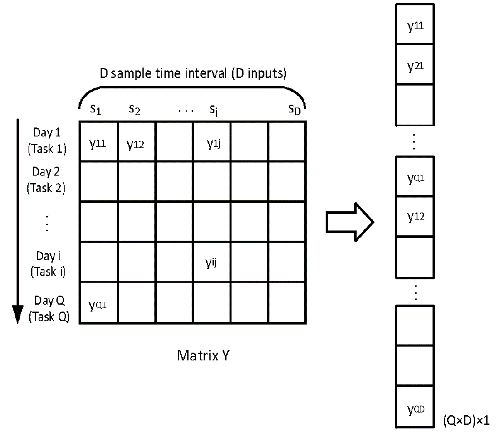
Assuming we have \(Q\) tasks and a set of observations \(Y = \left\{ {{y_{i1}},{y_{i2}}, \ldots {y_{iD}}} \right\}, i = 1, \ldots ,Q\), for each corresponding task at \(????\) distinct inputs, where \(????_{????????}\) is the response for \(????^{????ℎ}\) task given the input \(????_????\).
FIGURE 1 Vectorization of matrix Y
When the SM-MTGP model is introduced to the imputation of missing values of transfer passenger flow, the shared information of tasks is considered in terms of the temporal relatedness of various days. Transfer passenger flow over \(Q\) days can be treated as \(Q\) tasks, and the number of sampling time intervals \(D\) per day represents \(D\) distinct inputs. We define a matrix \(Y = \left\{ {{y_{ij}}} \right\}(i = 1,2,…,Q;j = 1,2,…D) \in Q \times D \), where \({{y_{ij}}}\) is number of transfer passengers for the \({i^{th}}\) day (task) on the \({j^{th}}\) time interval (input). By stacking the column vectors of \(Y \in Q \times D \), a \(Q \times D\) dimension vector \({\bf{y}} = vec(Y)\) is obtained (Figure 1).
The MTGP model of \({{\bf{\tilde y}}}\)can be described as Equation (1):
$${{\tilde y}_{ij}} = {m_{ij}} + \varepsilon ,\quad \varepsilon \sim N\left( {0,{\sigma ^2}} \right) \tag{1}$$ where \({m_{ij}}\) is the expected value of the element \({{\tilde y}_{ij}}\), and \(\varepsilon\) is an additive Gaussian noise with variance \({{\sigma ^2}}\).
$$m \sim N\left( {0,{\Sigma _Q} \otimes {\Sigma _D}} \right) \label{TGP} \tag{2}$$ $${\Sigma _Q} = K_Q^fG_Q^m, \quad{\Sigma _D} = K_D^fG_D^m \label{covariance matrix} \tag{3}$$ The covariance matrices \({\Sigma _Q}\) are defined as a product of kernel of days features (tasks) \(K_Q^f\) and the self-measuring kernel \(G_Q^m\), and \({\Sigma _D}\) are defined as a product of the kernel of time intervals features (inputs) \(K_D^f\) and self-measuring kernel \(G_D^m\).
$${K_Q^f} = k\left( {{y_i},{y_j}} \right) \in \mathbb{R}^{Q \times Q}, \quad {G_Q^m} = g\left( {{y_{i:}},{y_{j:}}} \right) \in \mathbb{R}^{Q \times Q} \tag{4}$$ $${K_D^f} = k\left( {{y_h},{y_l}} \right) \in \mathbb{R}^{D \times D}, \quad {G_D^m} = g\left( {{y_{:h}},{y_{:l}}} \right) \in \mathbb{R}^{D \times D} \tag{5}$$ where \(k\left( {{y_i},{y_j}} \right)\) and \(k\left( {{y_h},{y_l}} \right)\) indicate covariances of features of \({i^{th}}\) day and \({j^{th}}\) day, and covariances of features of \({h^{th}}\) time interval and \({l^{th}}\) time interval, respectively. Similarly, \(g\left( {{y_{i:}},{y_{j:}}} \right)\) and \(g\left( {{y_{:h}},{y_{:l}}} \right)\) measure covariances of self-measuring observations of \({i^{th}}\) day and \({j^{th}}\) day, and covariances of self-measuring observations of \({h^{th}}\) time interval and \({l^{th}}\) time interval.
By following the principle of MTGP, the joint distribution of \({\tilde Y}\) can be described as Equation (6), where \(\Phi = {\Sigma _Q} \otimes {\Sigma _D} + {\sigma ^2}{\bf{I}}\).
$$\int {p\left( {\tilde Y|M,0,{\sigma ^2}} \right)} p\left( {M|{\Sigma _Q},{\Sigma _D}} \right)dM = N\left( {{\bf{\tilde y}}|{\bf{0}},\Phi } \right) \tag{6}$$ Using a Gussian process framework given the observed number of transfer passengers, the unobserved passenger flows in \(Y\) can be derived by predictive equation (7). $$E[{{\tilde y}_{ab}}|{{{\bf{\tilde y}}}_{obs}},{\Sigma _Q},{\Sigma _D}] = \left( {{\Sigma _{{Q_a}}} \otimes {K_{{D_b}}}} \right)_{obs}^T\Phi _{obs}^{ – 1}{{{\bf{\tilde y}}}_{obs}} \tag{7}$$ where \({\Phi _{obs}} = {\bf{P}}\Phi {{\bf{P}}^T} \in \mathbb{R}^{M \times M} \) is a covariance matrix over the observed transfer passenger flows in \(Y\), \({{\Sigma _{{Q_a}}}}\) denotes \({a^{th}}\) column vector in \({\Sigma _Q}\), which measures the similarities between \({a^{th}}\) day and all the other days among \(Q\) days, and \({{K_{{D_b}}}}\) indicates \({b^{th}}\) column vector of \({K_D}\), which represents covariance between \({b^{th}}\) time interval and all the remaining time intervals of \(D\) samples.
EXPERIMENT
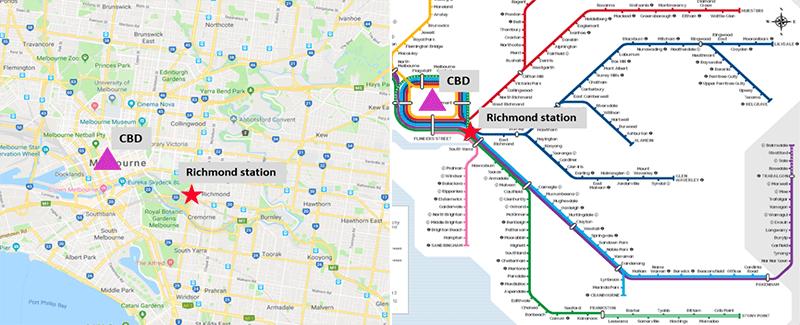
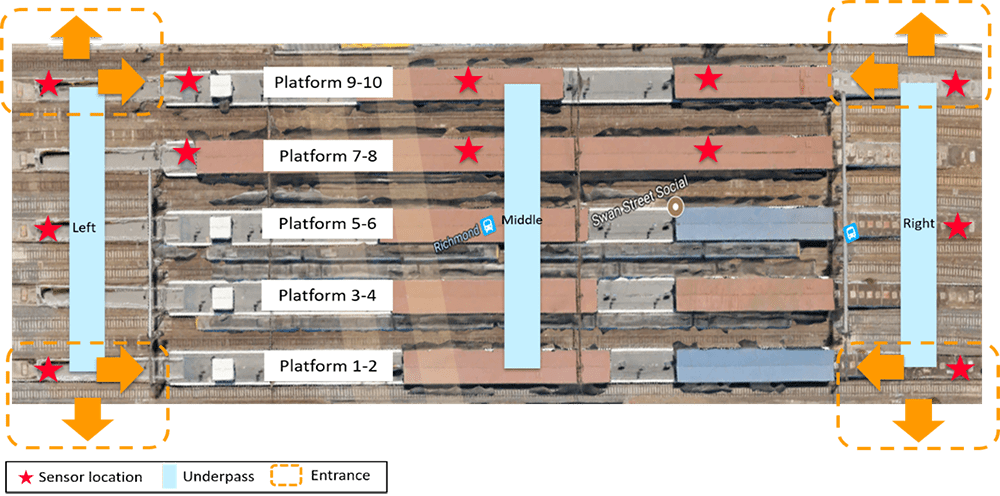
Data analysed includes 6-months of passenger flow data collected by WiFi sensors at Richmond railway station (Figure 2), Melbourne, Australia.
FIGURE 2 Map of location and train lines of Richmond station.
FIGURE 3 Map of 12 WiFi sensors distribution.
The deployed 12 sensors are distributed at platforms 7-10 and two sided underpasses (Figure 3).
IMPUTATION PERFORMANCE
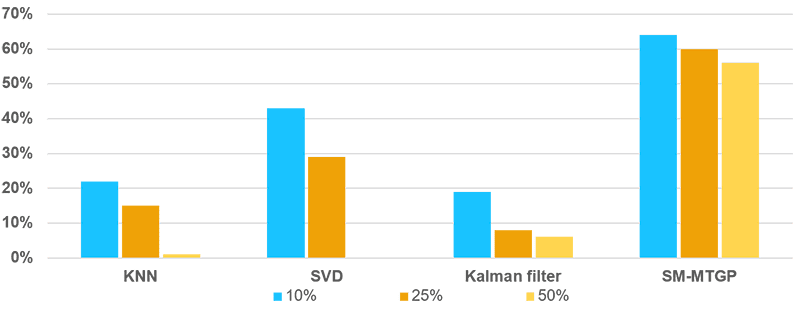
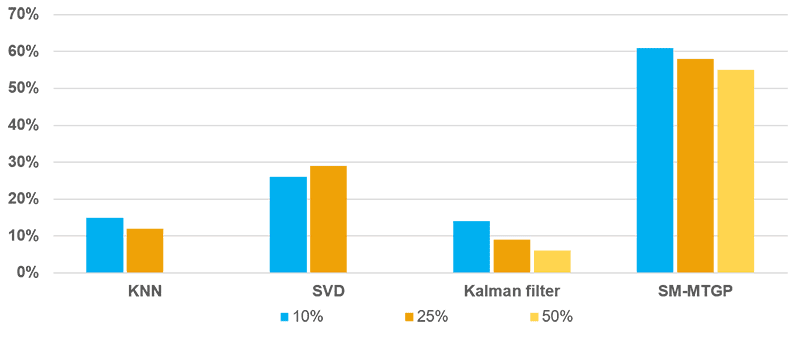
Figure 4 indicates the RMSE results of discrete missing pattern with various algorithms. The improvements in RMSE by SM-MTGP is around 60% for three different missing rates.
FIGURE 4 RMSE Results for Different Missing Ratios of Discrete missing data.
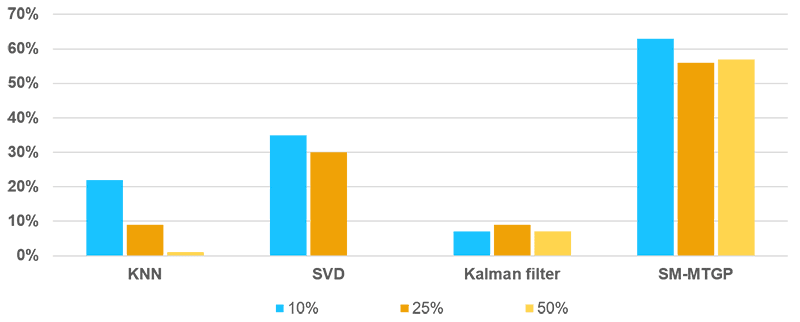
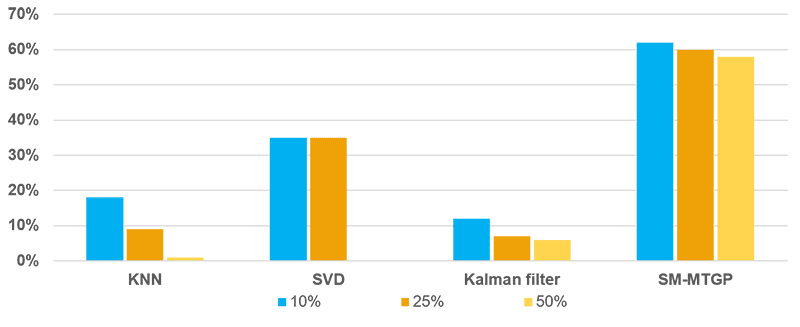
Three mixed missing patterns under different missing ratios are reported (Figure 5-7). The SM-MTGP method is still able to obtain better performance compared with all the other methods, leading to improvements in RMSE up to 60%.
FIGURE 5 RMSE Results for Different Missing Ratios of Mixed Missing Data
with One Random Day Missing.
FIGURE 6 RMSE Results for Different Missing Ratios of Mixed Missing Data
with Two Random Day Missing.
FIGURE 7 RMSE Results for Different Missing Ratios of Mixed Missing Data
with Four Random Day Missing.
CONCLUSIONS
Imputation accuracy can achieve around 60% improvement in RMSE in all the tested missing scenarios compared with the base model.
SM-MTGP significantly outperforms other methods under the large missing ratio.
On-going research on incorporating other features into this algorithm to make application on large-scale transit network and simplifying model computational complexity.
For more detailed information please contact our TUPA members below;
Wenhua Jiang, [email protected]