I had great time at Monash with my fantastic colleagues for 6 years. I cannot forgot what you have done to me. I have been formed by your great help. I am going to miss you all. Thanks and take care till we meet again.
I had great time at Monash with my fantastic colleagues for 6 years. I cannot forgot what you have done to me. I have been formed by your great help. I am going to miss you all. Thanks and take care till we meet again.
Inhi Keeps closely working with Monash University as an adjunct senior lecturer until 2023. Kongju National University and Monash University will collaborate in teaching and research continuously.

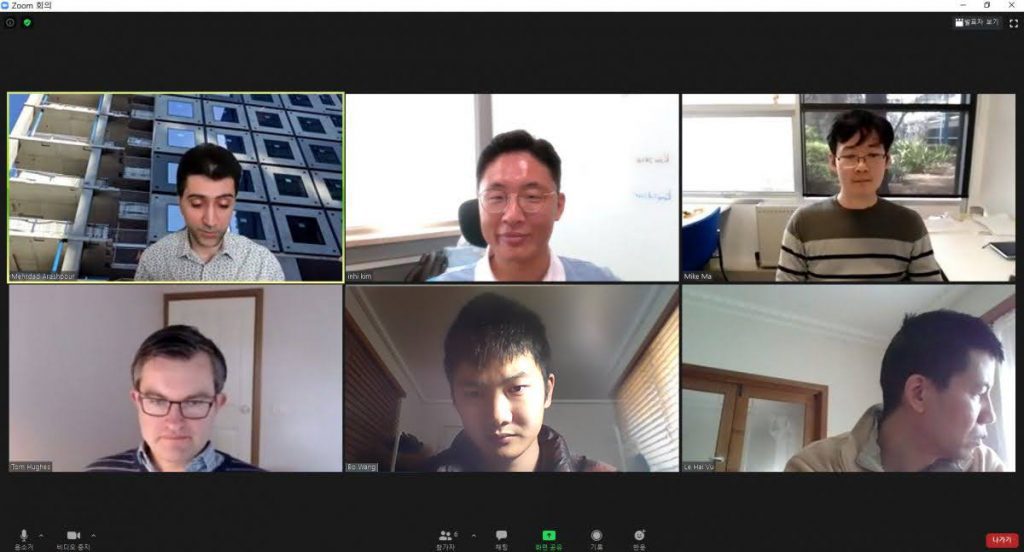
Congrats Bo! The mid review has been successfully completed.
Title
Short-term traffic state estimation and prediction based on spatiotemporal neural networks
Summary
Spatiotemporal neural networks (NN) models have recently achieved competitive results for short-term traffic prediction and achieved outstanding outcomes. However, two problems still require further study in terms of model performance and inner mechanism understanding: (1). The forecasting model affected by many aspects like model inputs, model structure, external factors, and optimisation function. How to design an appropriate framework for short-term traffic state prediction? (2). The existing related studies mainly use the knowledge and advantage from the neural network field, but how to incorporate transport domain kn owledge with the above framework? Therefore, th e aims of this study are: (1) Presenting an overall framework from data management to model training for traffic network state estimation and prediction, which provides better forecasting results and APIs for other applications. (2) Understanding the relations of components inside the framework and improving it by integrating transport domain knowledge. The outcomes of this study provide a general framework of the NN-based traffic forecasting model for practice and a better understanding, which will benefit the short-term traffic forecasting related research and industry.
https://www.youtube.com/watch?v=ptKB_hsGMEY&feature=youtu.be
Research Group
Transport
Research Theme
Monitoring, Prediction and Protection
Summary
Traffic incident is one of the factors causing traffic congestion on the roads. The traffic management centres start accumulating incident data to manage the congestion. However, the incidents are not properly managed because many minor accidents happen to be unreported. Therefore, systematic ways for detecting and accumulating events data are necessary. This research aim is to introduce a novel way of obtaining incident-related data and to develop a robust detection algorithm to recognize incidents and its type simultaneously by machine learning.
Bio
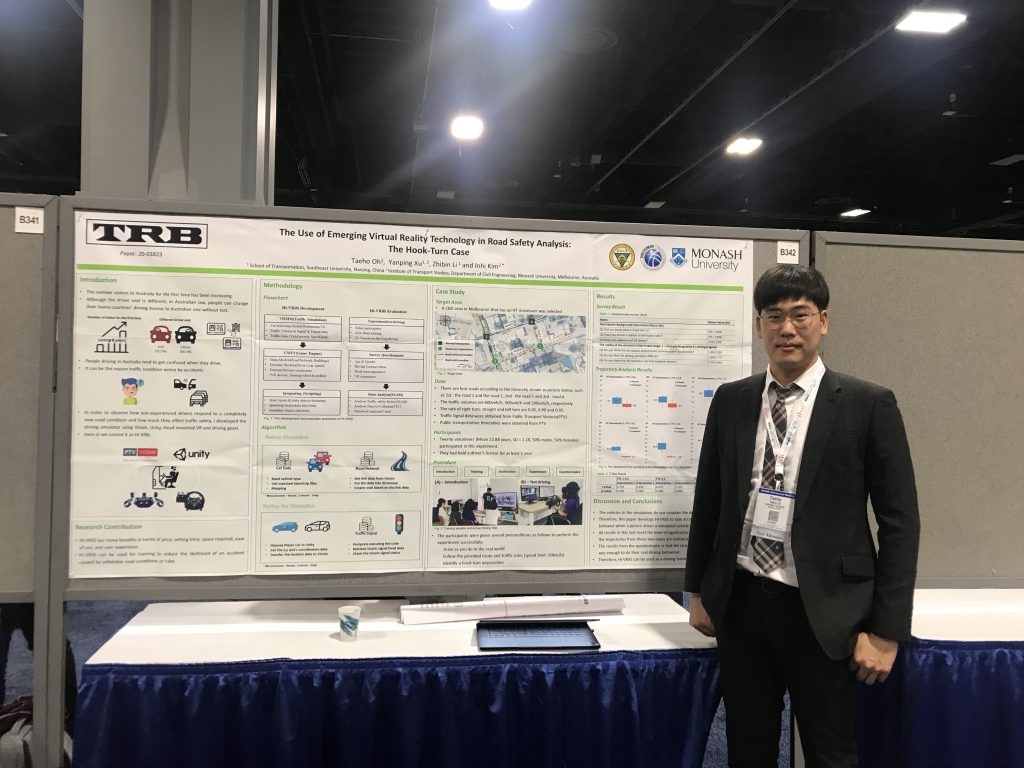
I received the M.S degree in transportation engineer ing from Kongju National University, South Korea in 2017. I commenced Joint Ph.D. degree with Southeast University, China in 2018 under the supervision of Dr. Inhi Kim, Prof. Graham Currie and Prof. Zhibin Li. Research interests include intelligent transport systems, traffic simulation, virtual reality, driving simulator and deep learning analysis.
The presentation can be watched below;
Research Group
Transport
Research Theme
Resilience, Infrastructure and Society
Summary
Although many strategies and policies have been advocated, either from the demand or supply aspect, to mitigate the traffic congestion, still, the problem remains to exist. A new perspective to visit the causes and to tackle this problem is urged. Extensive studies have revealed that the built environment can highly be associated with determining human spatial activities, especially automobile travel behaviors. Through travel behaviors, lead to the generation of traffic, which has an impact on traffic operation and control action. However, how the built environment directly influences the traffic performance (congestions and delays) have been rarely studied and lack of evidence.
In this context, this research aims to establish an in-depth understanding of the impacts of the built environment on traffic congestion at different spatial scales. Trying to answer the questions as 1) What built environment features are most relevant to the change of traffic congestion? 2) To what extent the change of the built environment features (by considering geographical scale) causes a difference in the traffic congestion level. 3) How can urban mobility and accessibility be optimized and enhanced via manipulating the design of the built environment? To address the above issues, the objectives of this research are 1) To synthesize the critical built environment indicators that hold accountable for the differences in traffic performance between areas; 2) To quantify the relationship of the built environment in raising the traffic congestion at different spatial scales; 3) To inform the built environment policy framework towards optimized transport planning and management .
By knowing this relationship, the outcome of this research can help guide the design of the urban/transportation planning policy for urban sprawl controls and mobility enhancement from the beginning design of the land use and the infrastructure implementation plaN.
For his presentation the video is below
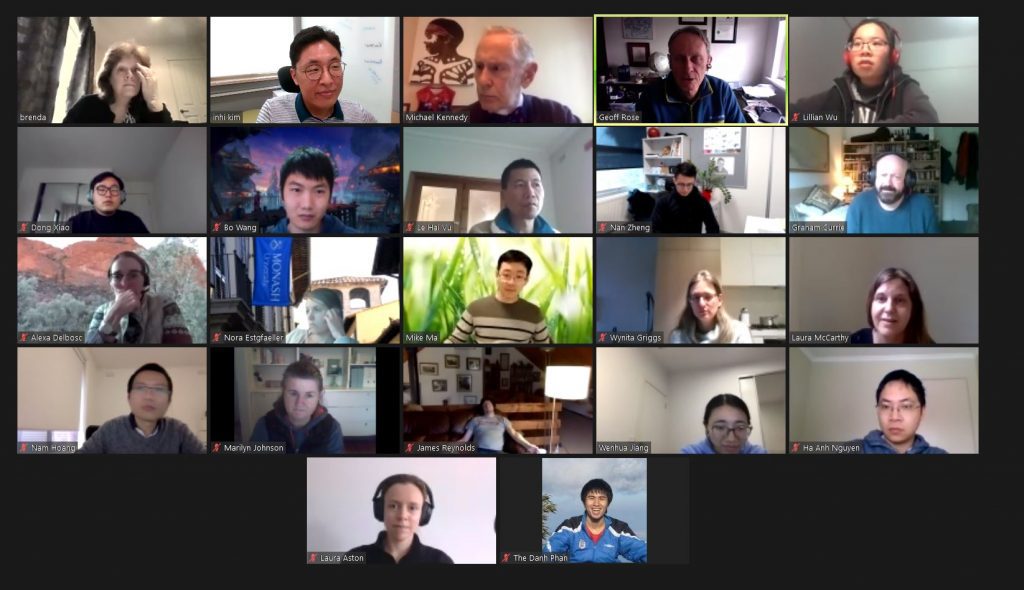
Big congrats. Lilian has successfully passed the progress review with outstanding marks.
Please join to watch her seminar.
This research is to integrate communication, traffic and driver behaviours, vehicle dynamics, and environment conditions in a unison framework to increase safety, reliability, and performance of connected and automated vehicles within a mix traffic condition.
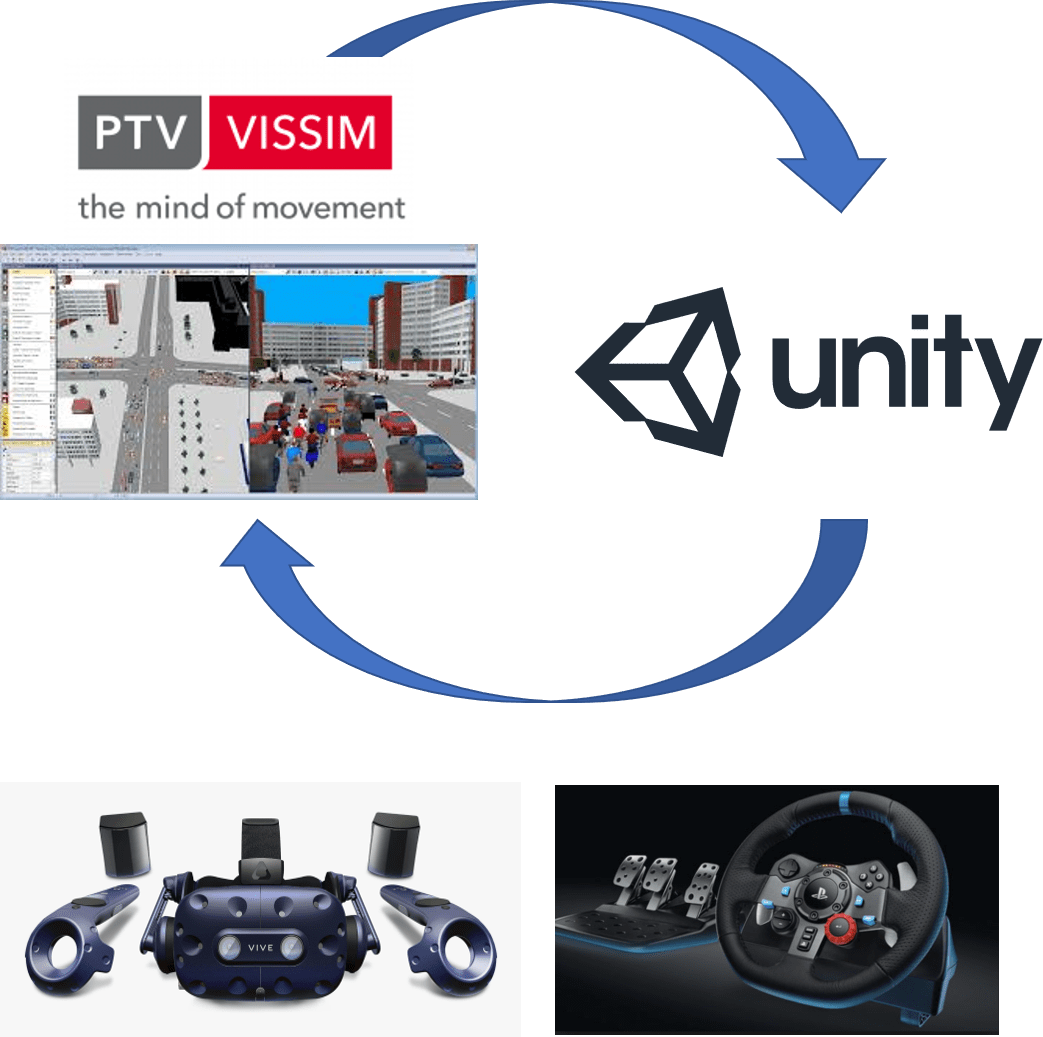
To achieve this goal, TUPA has been developing an architecture that leverages existing tools like VISSIM, Driving simulator, Virtual Reality and Python to analyze and simulate multiple aspects of traffic including vehicles and pedestrians. This tool will enable to develop and validate techniques to improve traffic congestion, safety, and network performance.
In designing scenarios for the integration of Vissim and Driving simulator, a robust algorithm has been successfully implemented in the platform. This algorithm adapts its behaviour (traffic flow in transport) autonomously in response to the variation of network conditions.
Having human in the loop setting, alternative route guidance information will be displayed in driving simulator so that driver’s decision if he or she is willing to change the route based on the information will be recorded. In this process, the subject vehicle in the simulator and surrounding traffic in VISSIM will interact each other. In addition, all recoded outcomes from the driving simulator will be input to traffic simulation for the large network evaluation. The developed traffic simulation will identify typical traffic indicators such as delay and extreme delay, queue and the number of stops based on the scenarios developed in the driving simulator.
This research keeps developing with the KAIST team since middle of 2019. Transportation experts are aware that it is urgent to take measures to cope with mixed traffic between autonomous vehicles and conventional vehicles, which will be indispensable in the future. It is expected that this new traffic flow not only directly and indirectly leads to traffic accidents but also has a serious side effect on traffic efficiency. Until a fully autonomous vehicle occupies the road, new traffic control techniques are needed. In this study, we propose a new traffic signal controller that supports autonomous driving by driving the driver safely through the virtual environment. This study is expected to be synergistic effect of performance evaluation for future traffic in conjunction with the Connected ITS project and the K-City autonomous vehicle test bed currently underway in Korea. It is expected that many universities and research institutes will benefit from this research since Korea has not developed a human participatory machine learning platform using virtual reality or is in the very early stage.
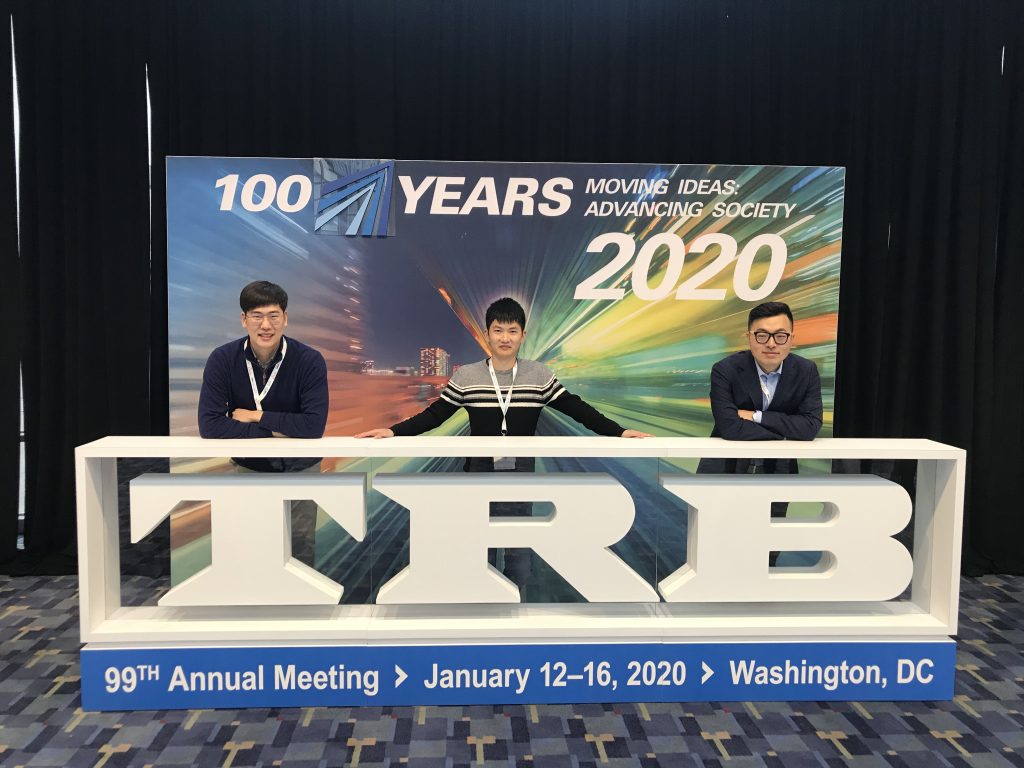
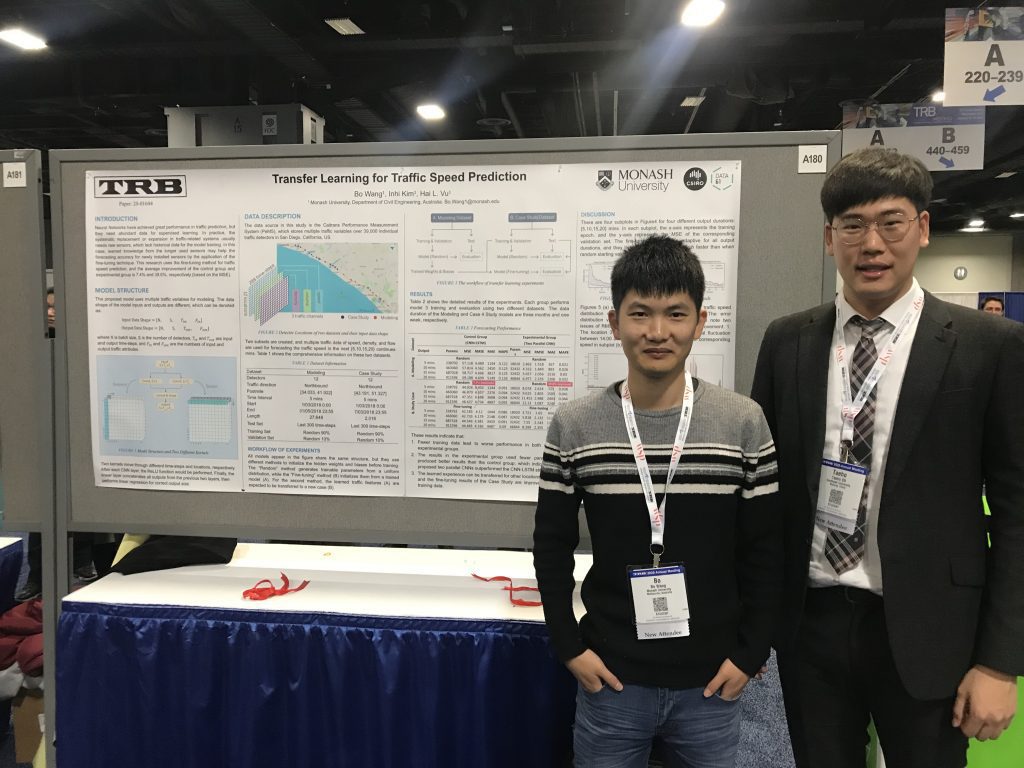
I am pleased that TUPA has made good outcomes at the 99th TRB conference.
© 2026 TUPA. All rights reserved.