
Research Aim
To provide empirical evidence on the relationship between built environment and public sharing bike flow in Suzhou, China.
Research Objectives
- To examine the global impacts of built environment on public sharing bike flow.
- To understand the effects of spatial variation of those built environment on public sharing bike flow
Study Area
The study area of this research focuses on Suzhou located in the southeast Jiangsu Province of East China and east about 100 km to Shanghai (Figure 1(A)).
There are around 1,750 bike stations and 40,000 public sharing bikes put into use in Suzhou (Figure 1(B)).
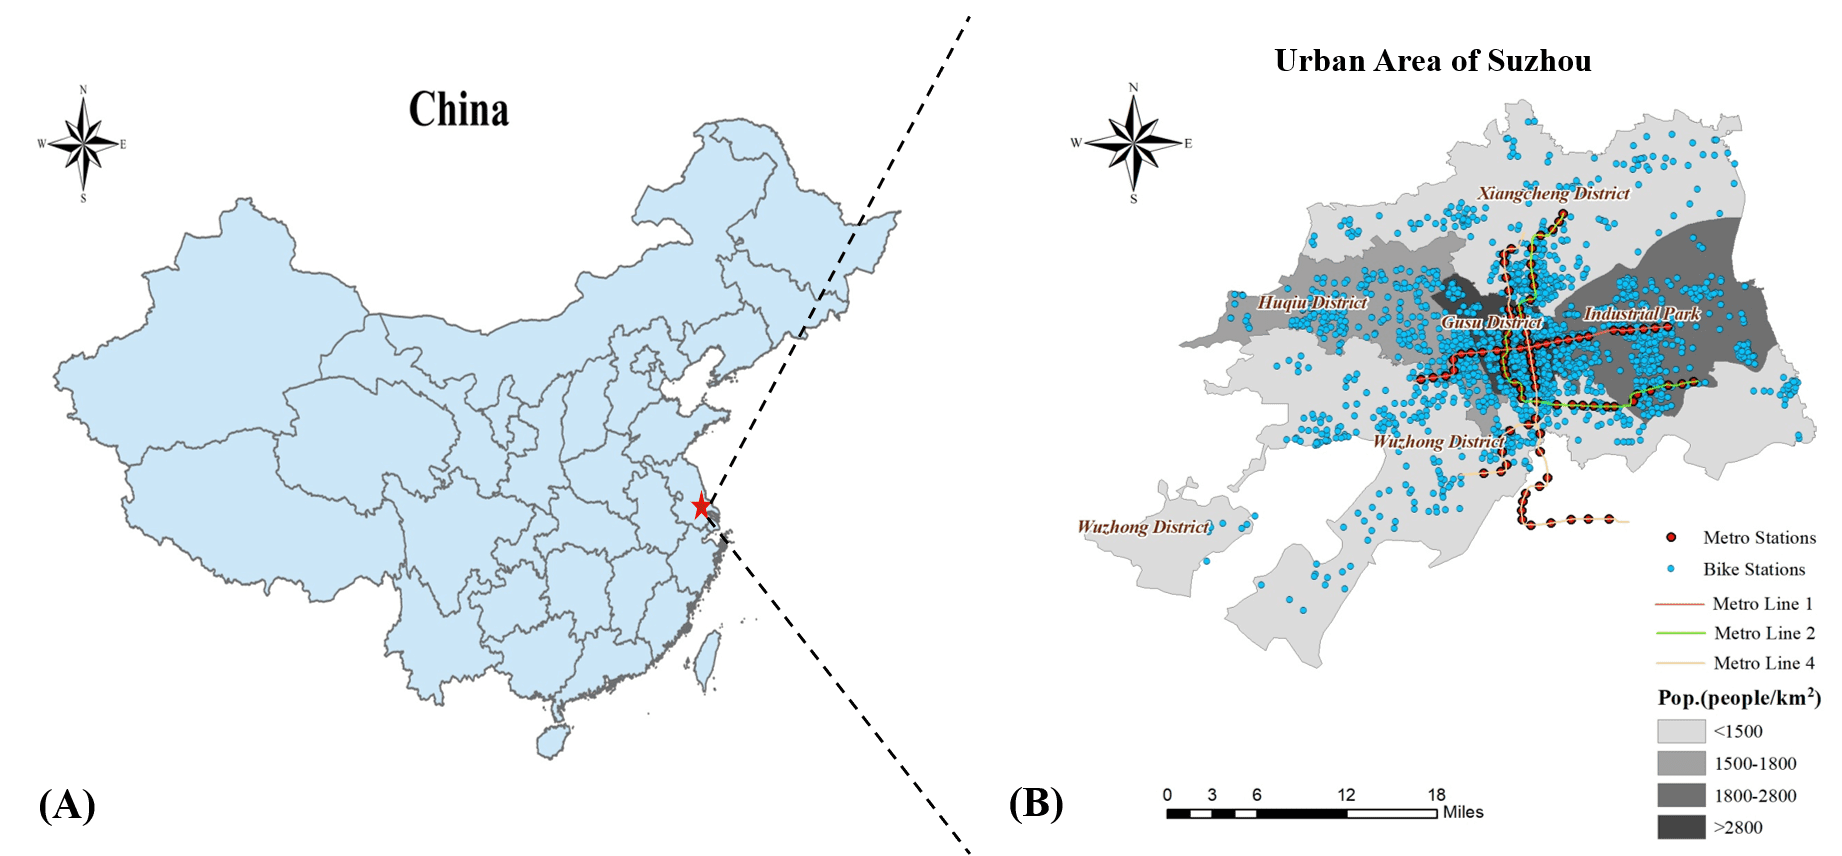
Fig. 1: Study area. (A) Location of Suzhou in China; and (B) the spatial distribution of bike stations, metro stations and population density in urban area of Suzhou.
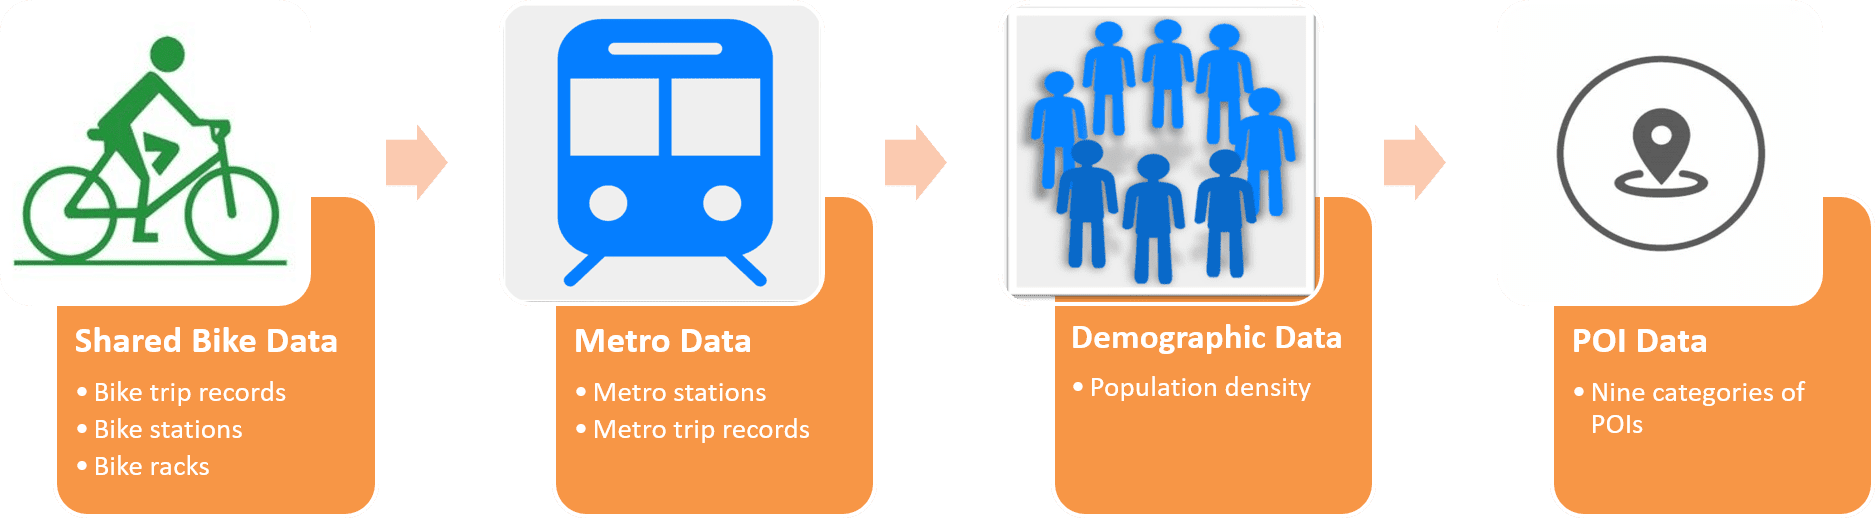
Data
Data Sources
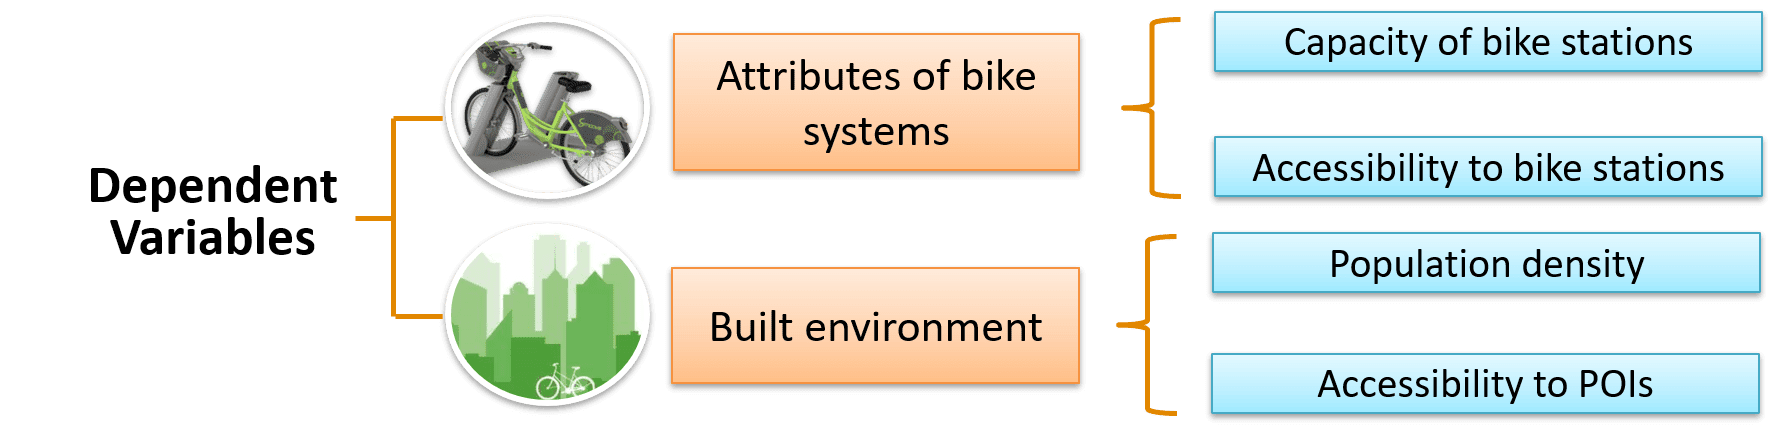
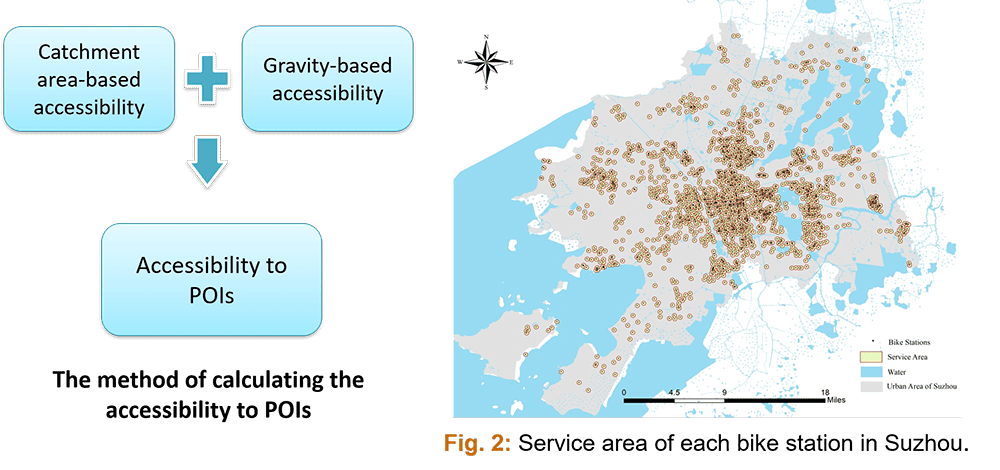
Operationalization of Variables
Methodology
Global Regression

Geographically Weighted Regression (GWR)
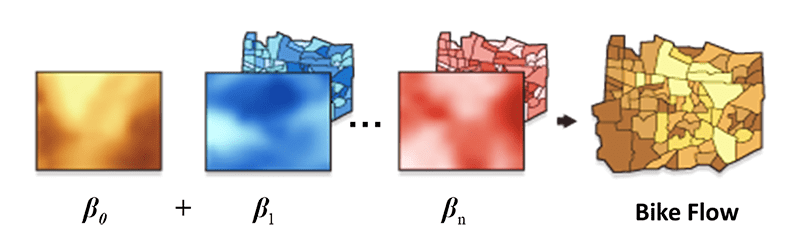
GWR is a local regression model. Coefficients are allowed to vary.
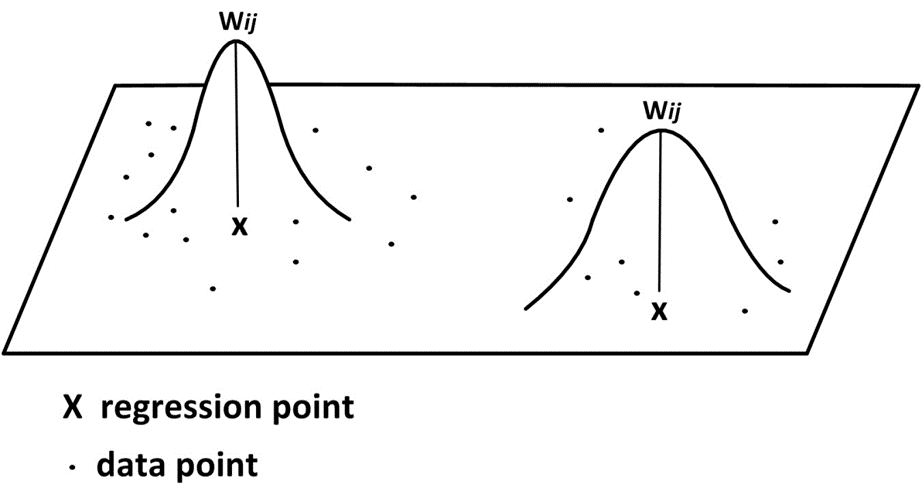
Bi-squared Weighting Function
Results and discussions
Global Regression
Table 1: The results of Global Regression.
| Dependent variables | Global Regression | |
| Trips on workdays | Trips on nonwork days | |
| Coeff. (t-value) | Coeff. (t-value) | |
| Intercept | -75.388 (-8.27) | -67.948 (-7.25) |
| Attributes of public bike systems | ||
| Capacity of bike stations | 3.508 (11.88) | 3.372 (11.11) |
| Accessibility to bike stations | 33.441 (14.66) | 27.991 (11.93) |
| Built environment | ||
| Population density | -2.2E-04 (-2.13) | -2.2E-04 (-2.00) |
| Accessibility to metro station | 4.852 (5.83) | 3.803 (4.44) |
| Accessibility to shopping mall | 8.254 (4.23) | 10.003 (4.99) |
| Accessibility to bus station | 6.719 (3.23) | 6.054 (2.83) |
| Accessibility to restaurant | 1.075 (5.82) | 1.491 (7.84) |
| Accessibility to dwelling | 0.544 (0.49) | 0.411 (0.36) |
| Accessibility to local financial services | 11.608 (6.84) | 11.494 (6.59) |
| Accessibility to public leisure and religion place | -3.258 (-2.22) | -0.906 (-0.60) |
| Accessibility to public park | -7.613 (-1.22) | -1.131 (-0.18) |
| Accessibility to educational place | 7.276 (3.83) | 9.130 (4.68) |
| Accessibility to workplace | 5.190 (3.78) | -1.610 (-1.14) |
| R-square | 0.392 | 0.360 |
| Adjusted R-square | 0.387 | 0.355 |
Note: Values in bold are significant at 0.1 level.
Geographically Weighted Regression (GWR)
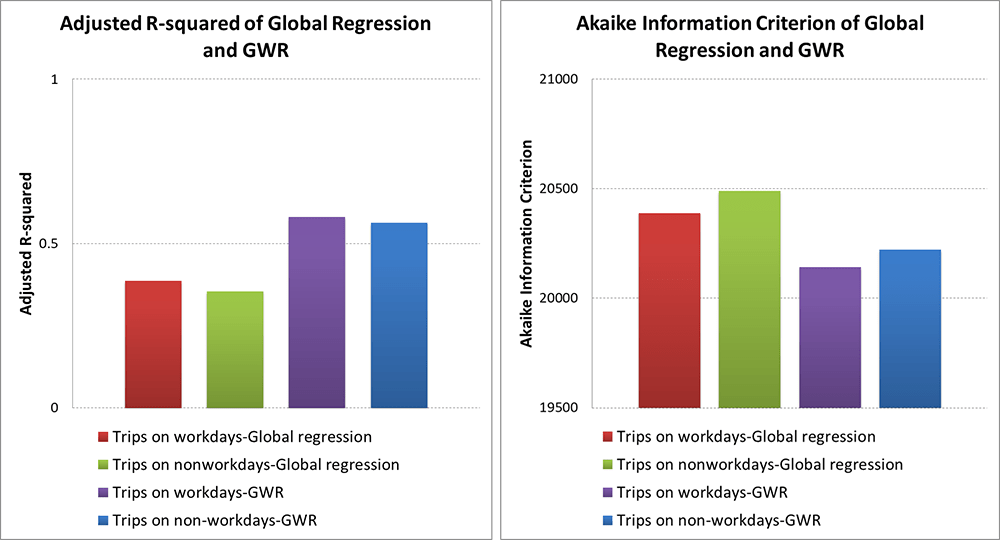
Fig. 3: Comparisons of explanatory power of Global regression and GWR.
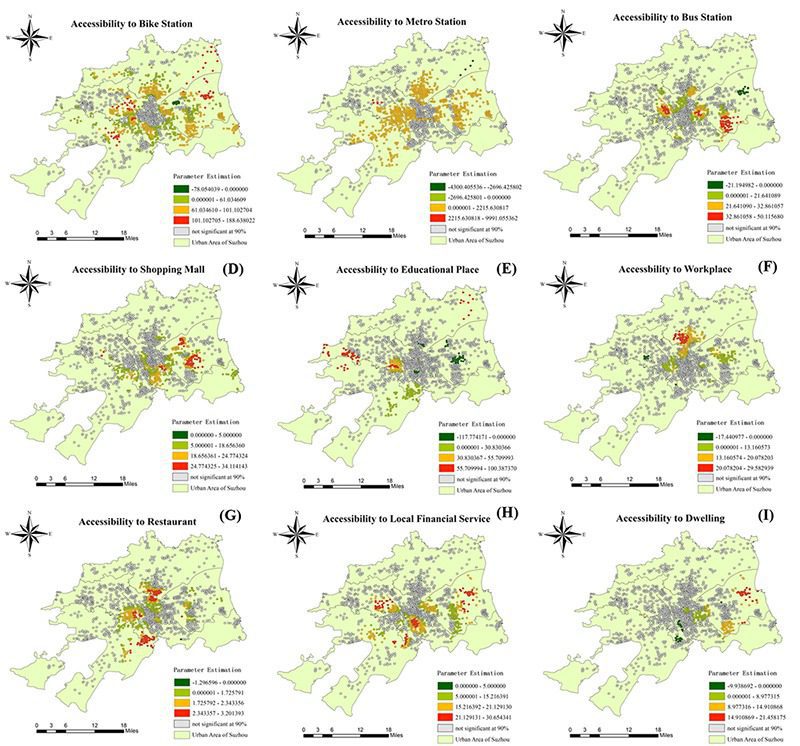
Fig. 4: Spatial distributions of local coefficients on working day and t-value with significance less than 90%.
Conclusions
|
Global Regression |
GWR |
|
The capacity and proximity of bike stations are positively correlated with bike usage. Gravity-based accessibility to metro stations of bike stations may increase bike flow. The bike stations nearby shopping malls, bus stations, restaurants, financial and educational places are also positively correlated with bike usage. Population density has a statistically negative impact on bike usage. |
The effects of built environment are divergent across the Suzhou region. Most of the coefficient appears to have zero or negative value in the central areas of Suzhou (Old Town) while surrounding areas have modest built environment effect on bike flows. |
The goodness of fit in the GWR is better than the global regression model.
Acknowledgements
This work was supported by Jiangsu Industrial Technology Research Institute and Research Institute of Future Cities at Xi’an Jiaotong-Liverpool University.
For more detailed information please contact our TUPA members below;
Chunliang Wu, [email protected]
Comments are closed.